Is it time for Ethereum Classic traders to gear up for more losses

A double top at $77.5, spelled disaster for Ethereum Classic as the alt suffered a massive drawdown post 7 September. Heightened by a broader market sell-off, a single candlewick dropped all the way to $48.2 which marked a low of over 1-month for ETC.
Moreover, the past few days saw ETC gridlocked between two Fibonacci levels; a breakdown would transpire into newer lows. At the time of writing, ETC traded at $56.1 with a market cap of $7.26 Billion.
Ethereum Classic Daily Chart
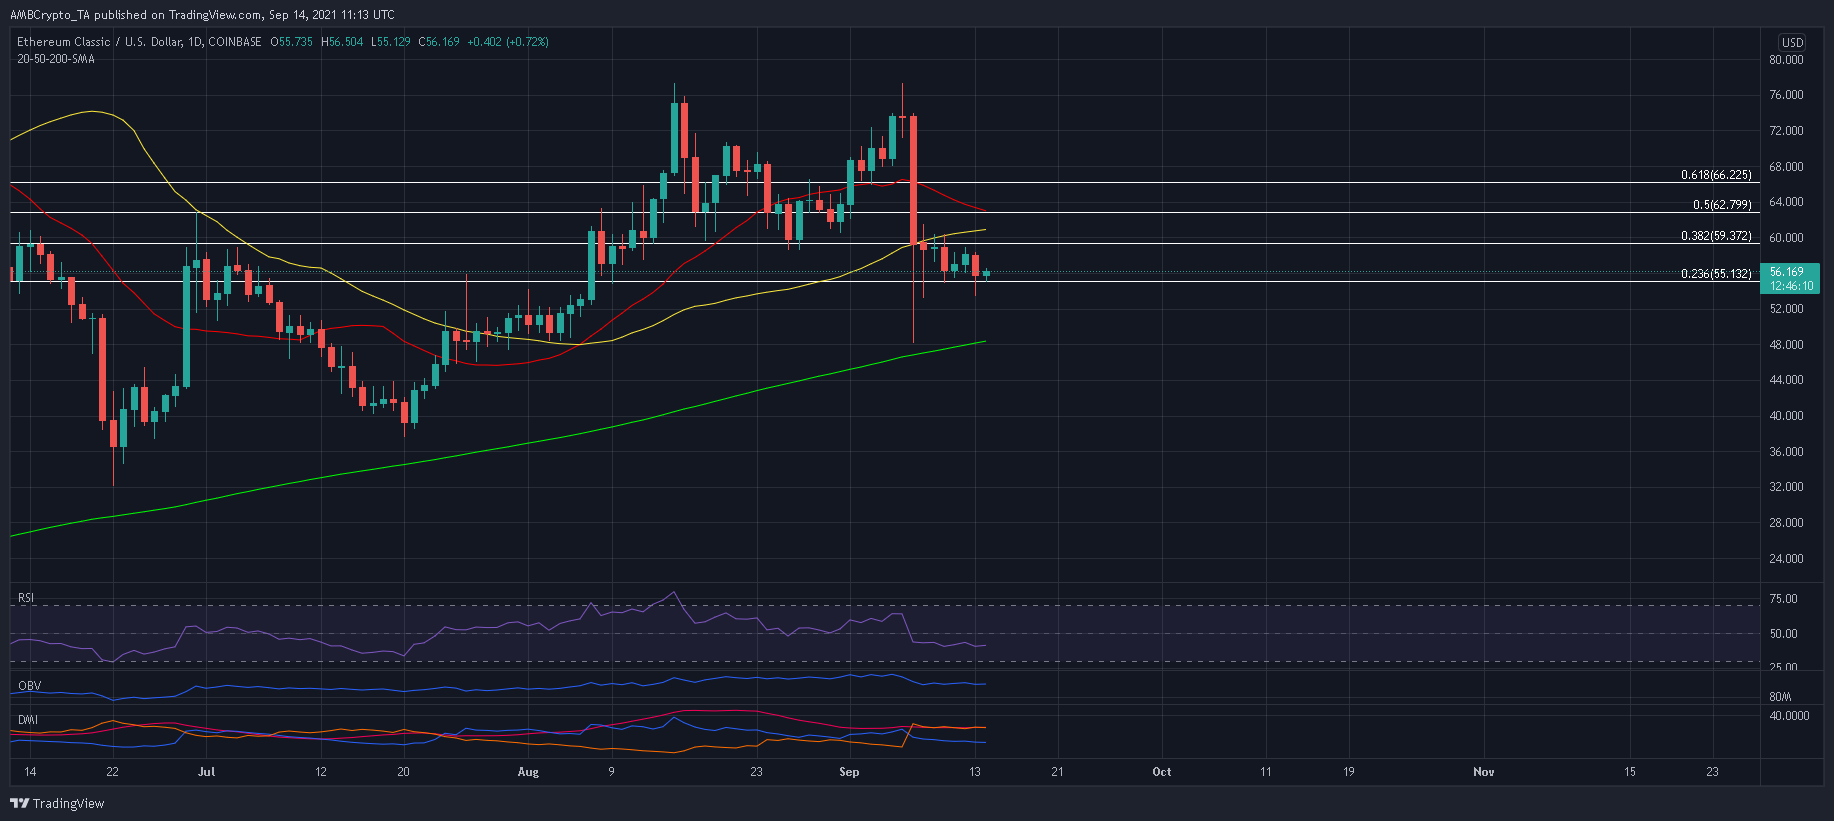
A close look at ETC’s chart showed that the prices had already pierced below their 20 and 50 Simple Moving Averages. With momentum aiding the sellers, ETC slipped below its 38.2% Fibonacci level and tested the following support at $55.1.
A further southbound push would see ETC drop to newer lows at $53.4 and $51.5. If buyers fail to stem the bleeding, ETC may even drop all the way towards $48.3, bringing the 200-SMA (green) into play. From there, ETC’s July lows will come under the spotlight.
Moreover, the bulls had their work cut out in order to enforce a revival. For such an outcome, ETC needed to challenge the 50% Fibonacci level whilst also closing above its daily 20-SMA (red). The base-case scenario would call for a comeback towards the $66-mark.
Reasoning
Interestingly, the On Balance Volume showed that buying pressure, which had picked up since July, had now lost its pace. The index saw a dip post 7 September and went flat. The Relative Strength Index also indicated weakness and traded below 45 over the past week. Meanwhile, the Directional Movement Index’s -DI floated above the +DI, a reading which often dissuades buyers from the market.
Conclusion
ETC swam in dangerous waters after closing below its 38.2% Fibonacci level. Further downside was expected till $48.3 especially due to the lack of buying pressure in the market. For traders, a decent buy opportunity would be elusive till ETC touched its 200-SMA. To negate a bearish outcome, ETC needed to climb above its 50% Fibonacci level on strong volumes.


