
- Chainlink formed a potential double bottom pattern
- The long-term UDPI suggests LINK has hit the floor
Chainlink [LINK] has seen significant developments through partnerships with various industry players. This has boosted its adoption across the cryptocurrency space.
At the time of writing, on the daily timeframe, LINK’s price seemed to be moving in a descending trend channel. Now, while this has been the case since June, it recently found a potential floor. The floor to be confirmed if the price breaks the short-term high at $13.
LINK’s price, which has been trending south lately, took liquidity below $13 and found support at $9.42. Here’s where the double bottom appeared to be forming.
The MACD also flipped bullish, partially confirming this pattern. That being said, the key test will come if LINK can break the $13-level.
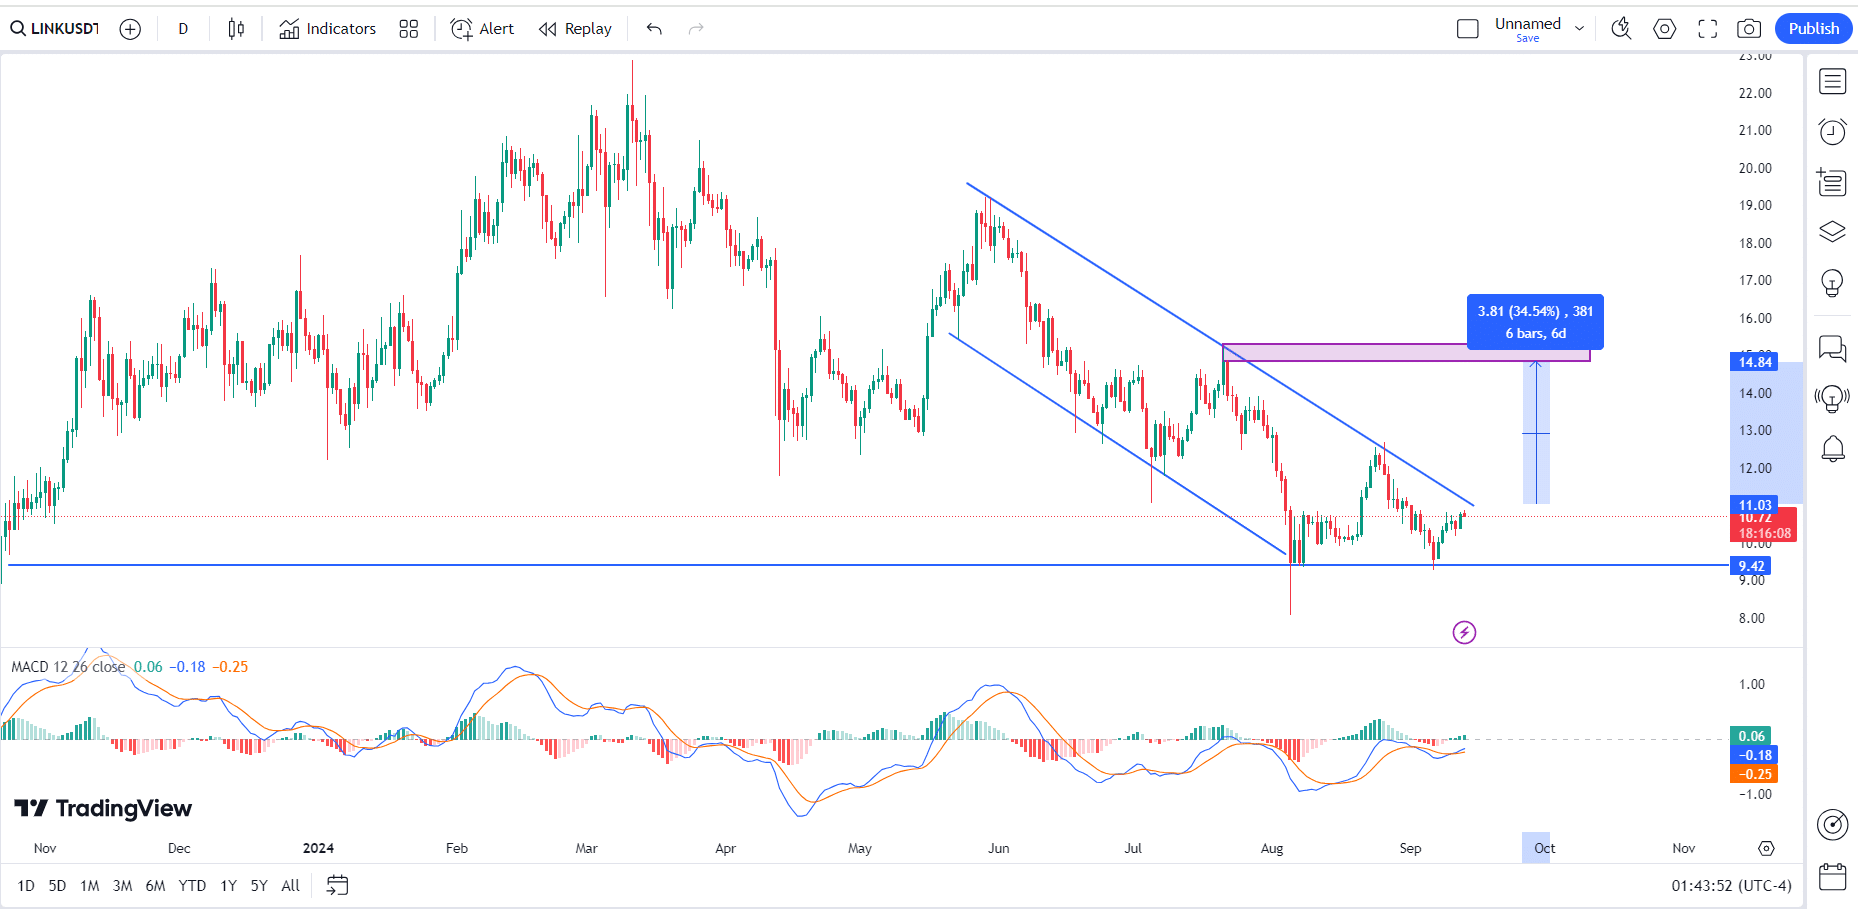
Source: TradingView
Should the price climb above the upper trendline and stay there, it could signal a 35% hike if the total altcoin market cap supports this move. However, if LINK breaks below its prevailing support zone, it could continue to decline.
If the current bottom holds, Q4 of 2024 might be bullish for LINK. This will present an ideal entry point for traders and investors betting on a price recovery.
Chainlink long-term UDPI risk model
The long-term Upside-Downside Potential Index (UDPI) risk model for LINK is also at historically low levels now.
This model, which evaluates risk-reward scenarios over time, suggests that LINK has a greater potential for gains when the UDPI is low.
The current market sentiment around LINK is extremely low, with price action and bullish activity subdued. However, the UDPI revealed that LINK is at its lowest risk level – A critical point to watch as Q4 approaches.
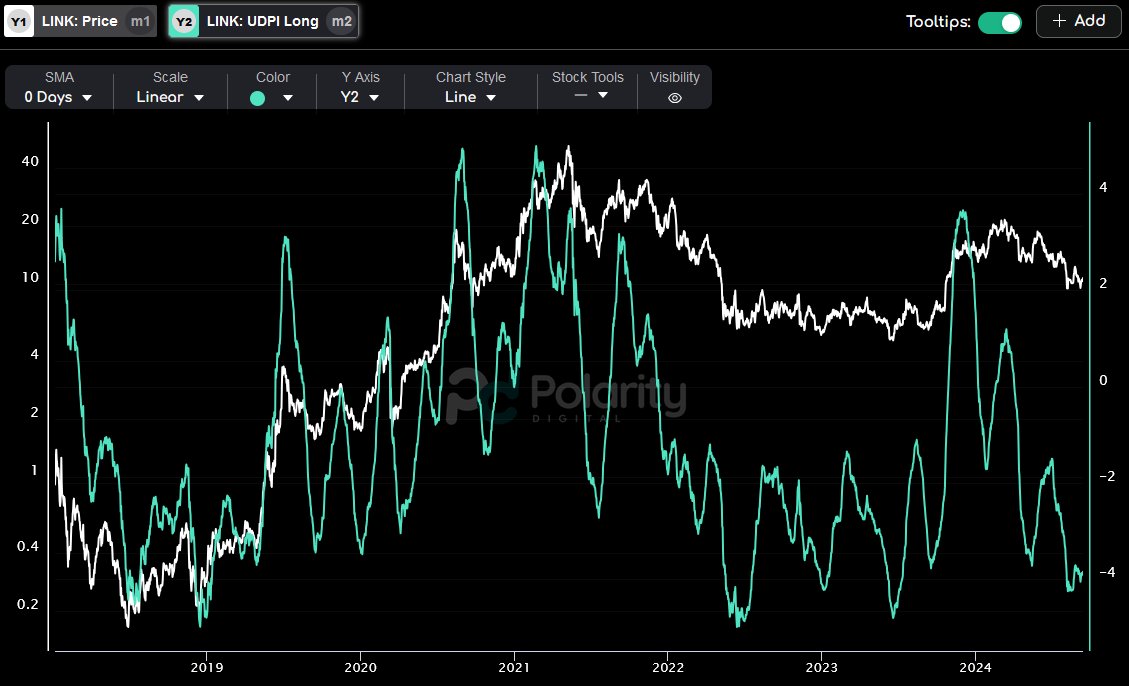
Source: Polarity Digital
Historically, such levels have marked deep value zones for LINK. And, a reversal could be imminent if market conditions align.
NVT ratio growing…
Additionally, Chainlink’s on-chain activities have been increasing too, with its network value to transaction (NVT) ratio showing growth.
The steady hike in NVT from the start of the year indicates surging activity on the Chainlink blockchain.
This is a bullish signal for LINK, one supporting the idea that the price has found a solid floor and could move higher soon.
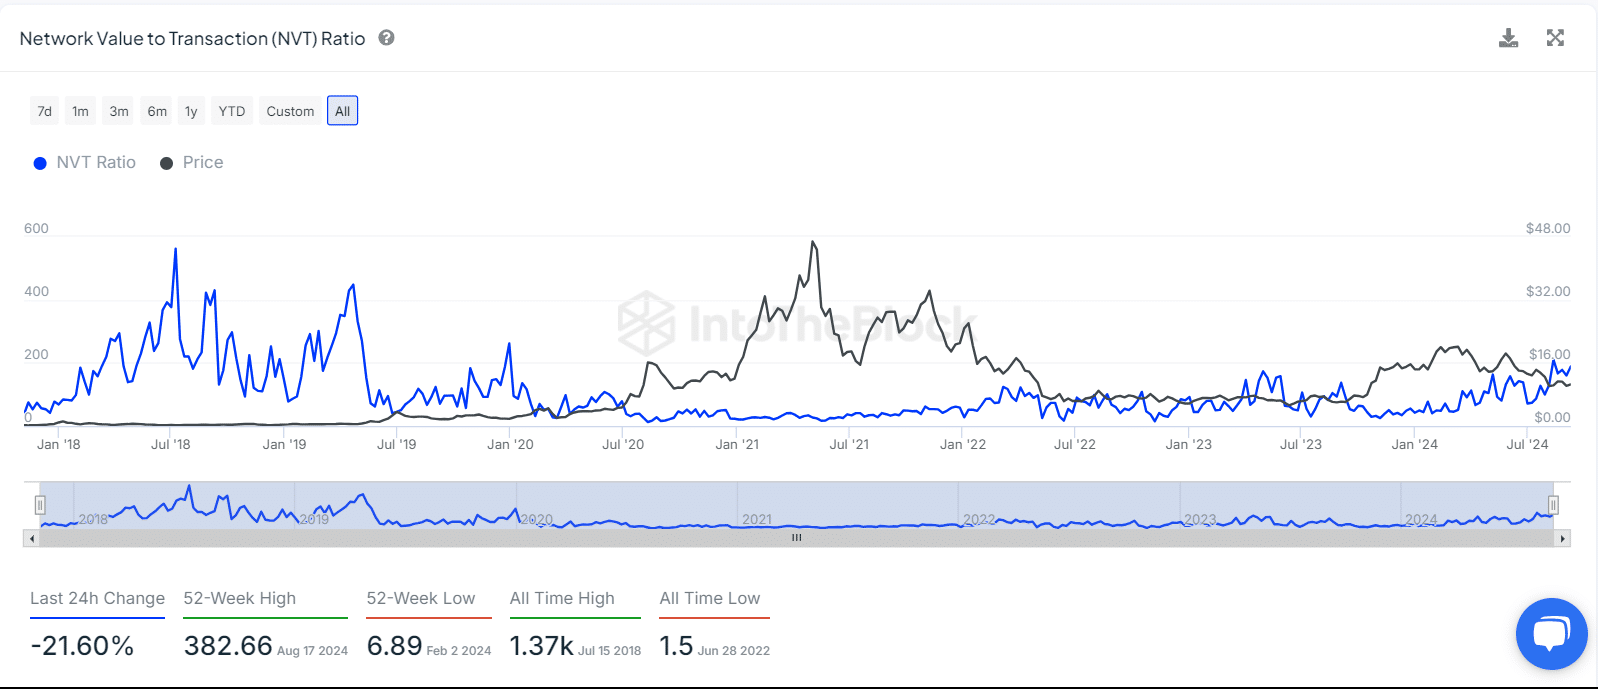
Source: IntoTheBlock
Chainlink’s social dominance
Finally, LINK’s social activity has surged too. Among the top 10 crypto projects, Chainlink has a social dominance rate of 1.65%, based on social posts and engagements across various platforms.
This growing social engagement further bolsters the bullish sentiment for LINK. Especially as increased social visibility often correlates with higher interest and potential price movements.
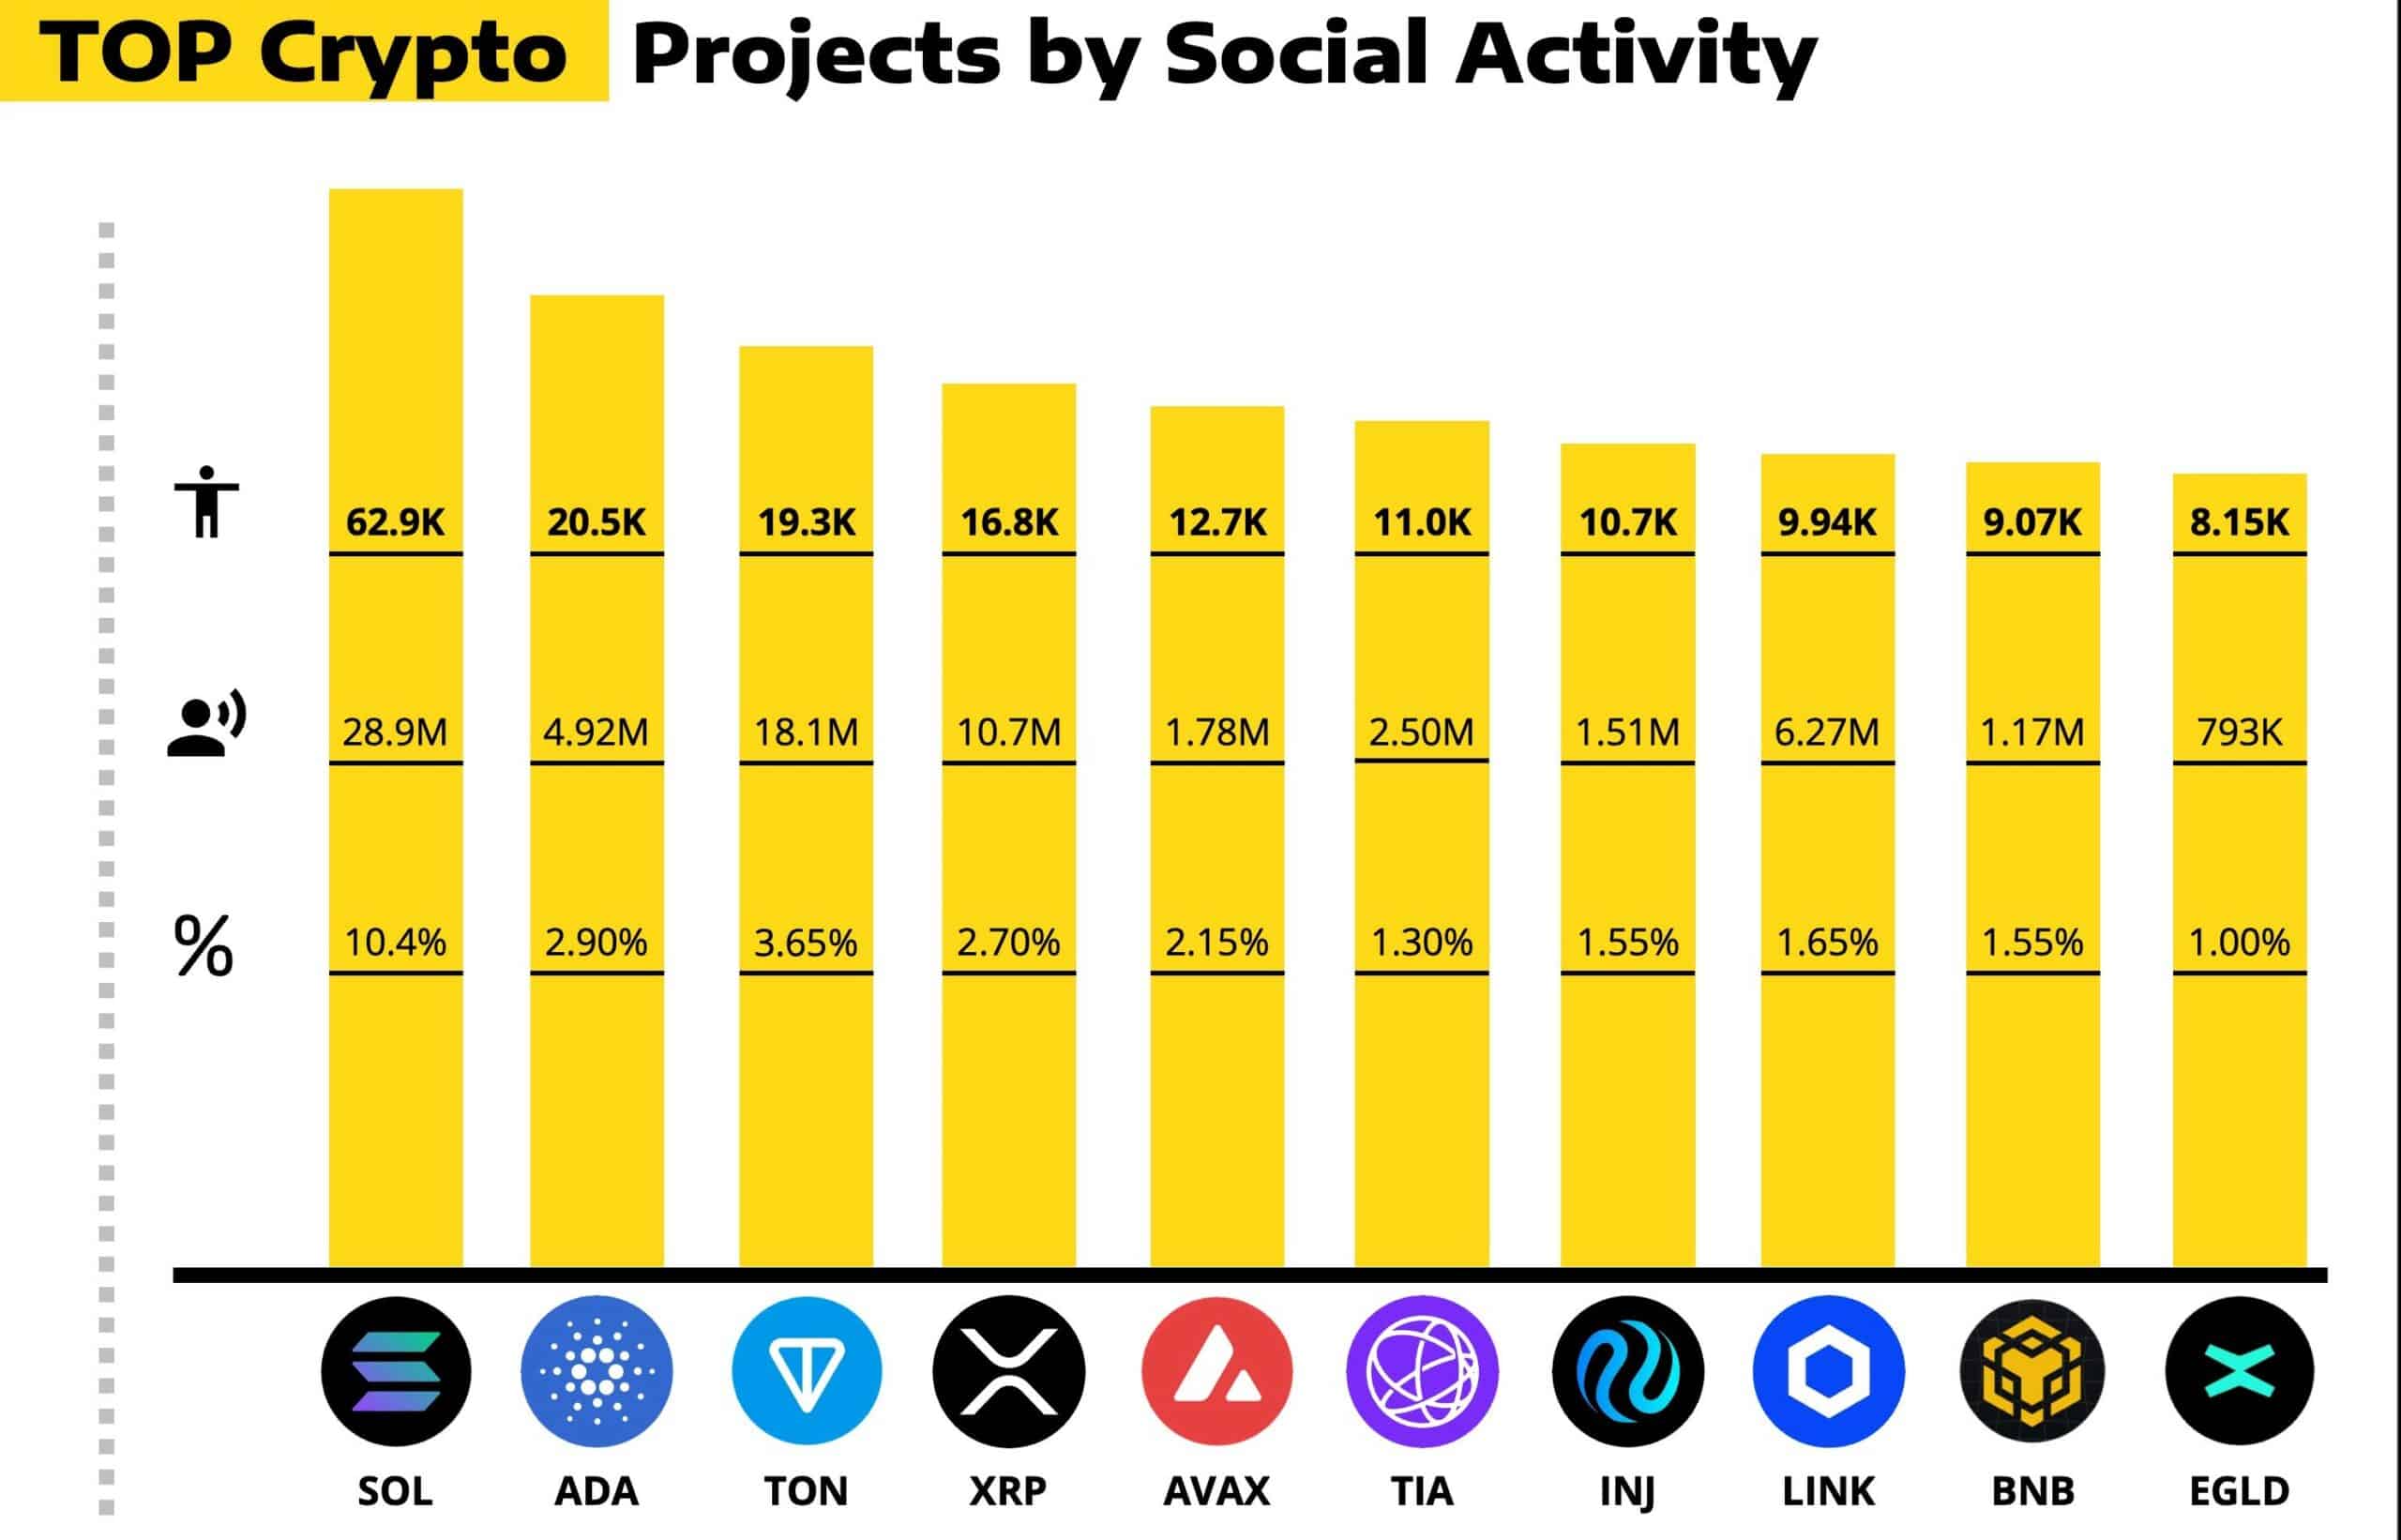
Source: LunarCrush
In conclusion, Chainlink’s recent partnerships, on-chain activity, and social dominance all point to the potential for a higher price if market conditions improve.
If LINK holds its current support and the double-bottom pattern plays out, the coming months could see a significant move upwards in price.


