


Disclaimer: The information presented does not constitute financial, investment, trading, or other types of advice and is solely the writer’s opinion.
- Litecoin lacked a trend on the higher timeframe charts.
- A pocket of liquidity just above prices was a place that could be tested shortly.
Litecoin [LTC] traded within a range formation in the past two months. At the time of writing, Litecoin was approaching a key resistance level. Even a breach of this level would likely not result in a strong bullish move.
Read Litecoin’s [LTC] Price Prediction 2023-24
A recent technical analysis by AMBCrypto noted that LTC was trading near a two-year low. However, Monday’s Bitcoin [BTC] pump meant LTC saw some gains, but these were quickly retraced. Can the bulls repeat the same once more?
The range formation curtailed Litecoin’s bullish enthusiasm
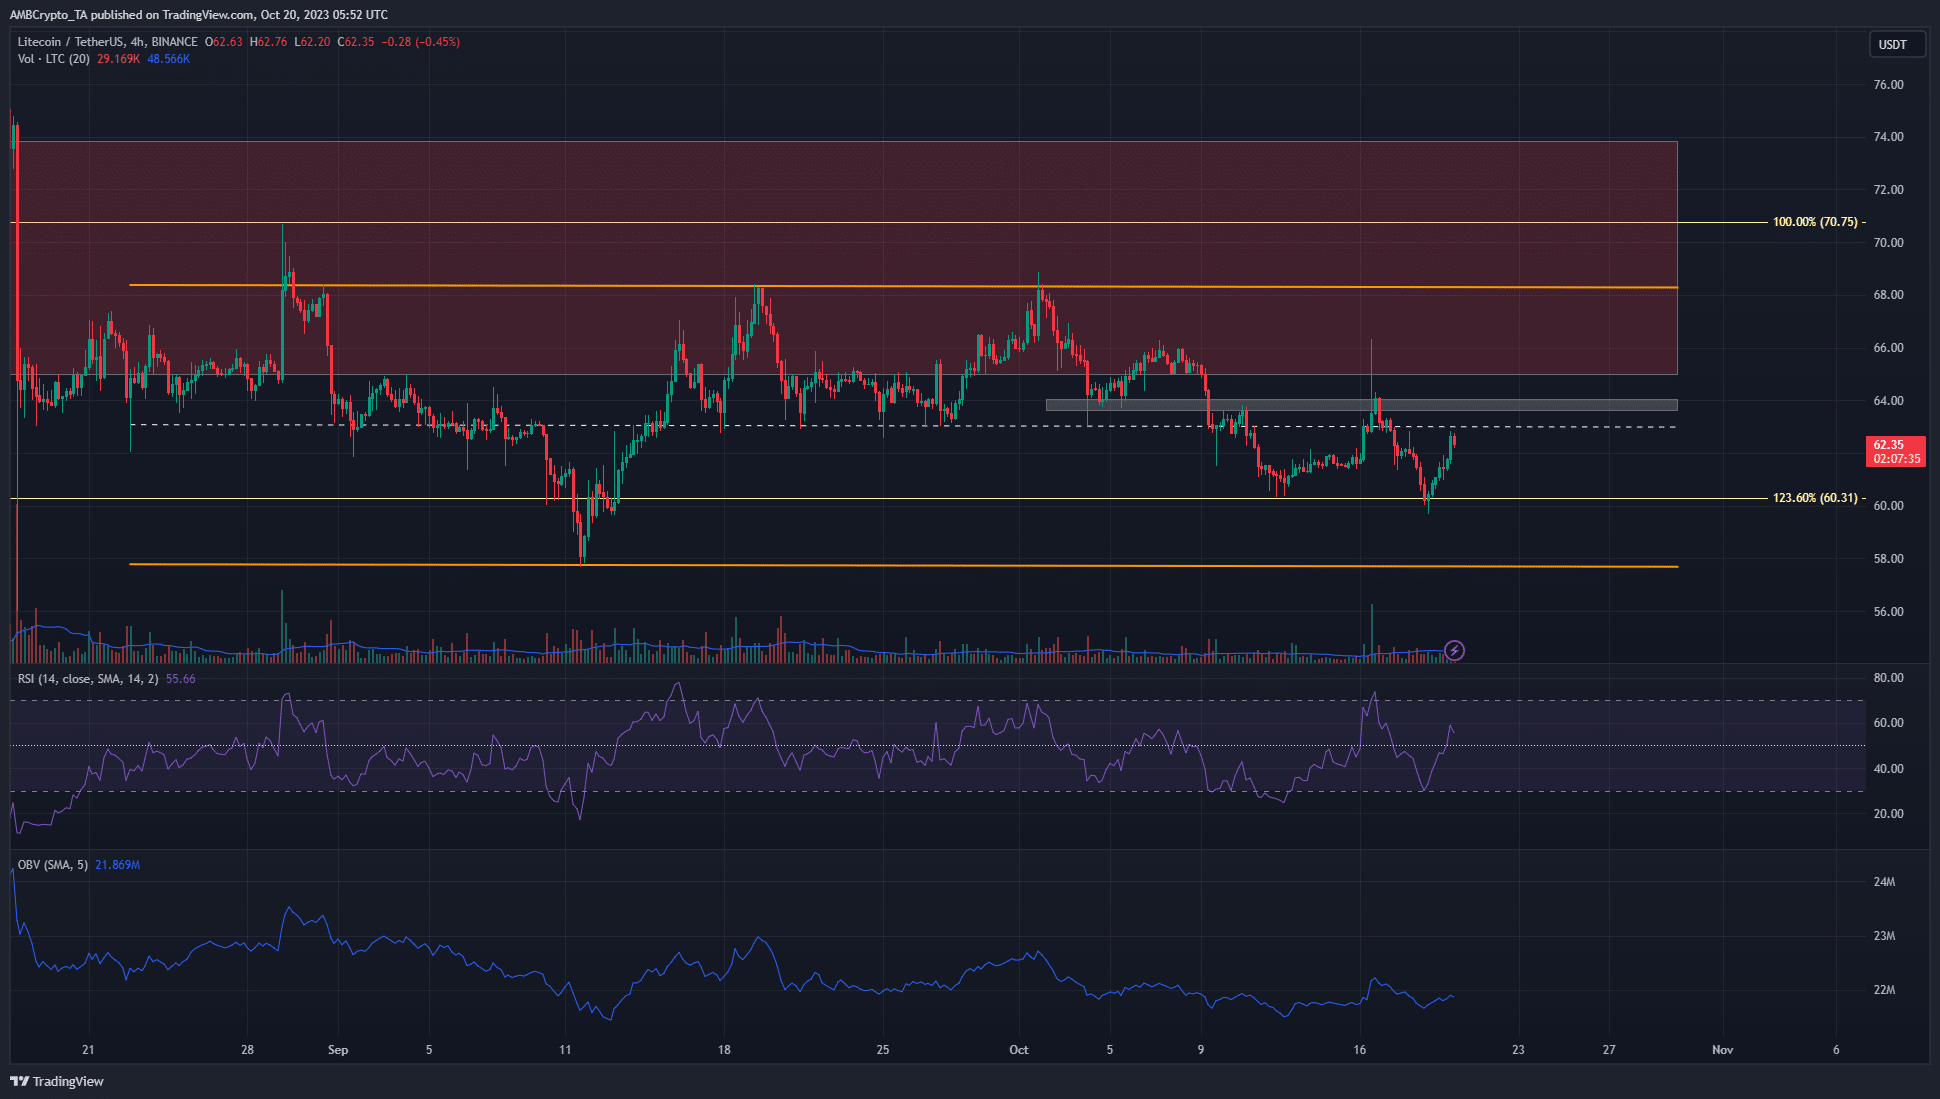
Since mid-September, Litecoin has traded within a range that extended from $68.3 to $57.8. The mid-range level was at $63 and has been tested several times as both support and resistance in recent weeks.
Additionally, there was a bearish breaker block in the $65-$73 zone that was plotted from the 1-day price chart. Combined with the mid-range resistance, it outlined a large territory under bearish dominion.
The RSI climbed above neutral 50, and the market structure was on the verge of flipping bullishly. In contrast, the OBV continued the downtrend it has been on since September. This reflected a lack of demand in the market.
The liquidation levels showed possible levels that could yield an LTC reversal
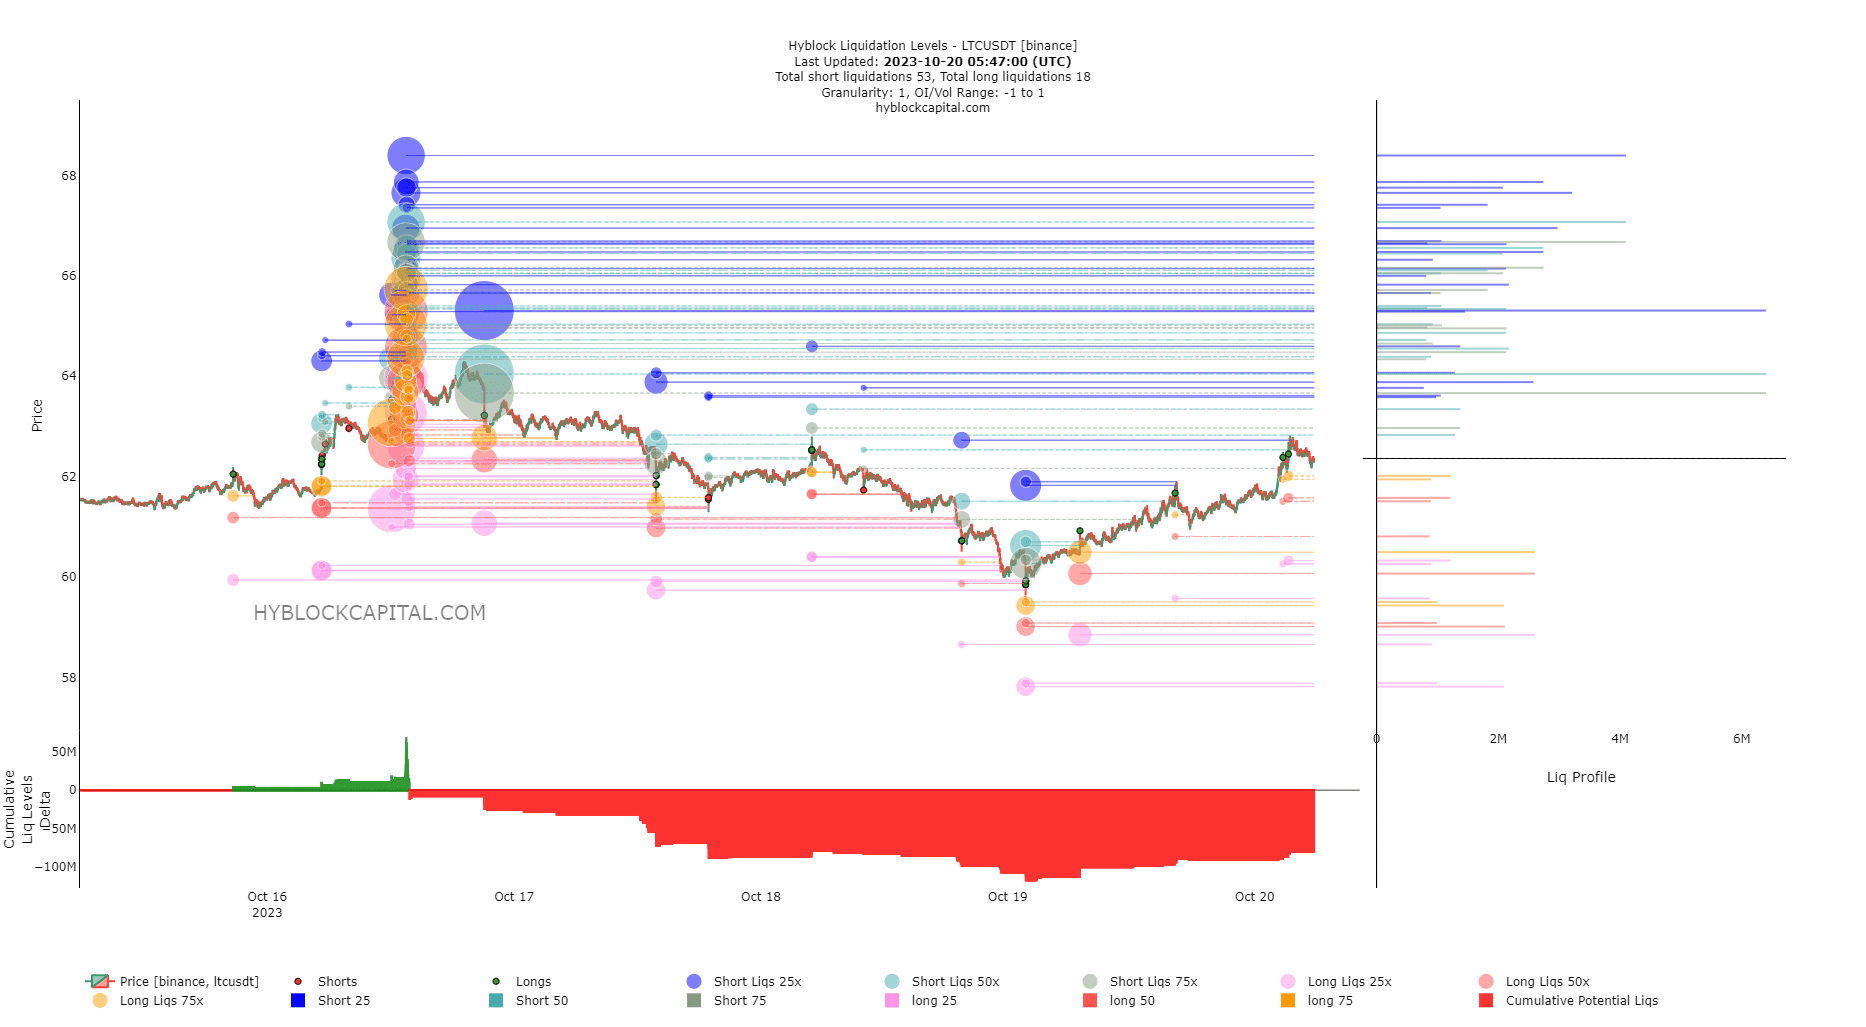
The Cumulative Liq Levels Delta showed a bullish bias. The metric tracks the cumulative sum of the difference between all long liquidation levels and all short liquidation levels across time. Positive values indicate that there are more long liquidation levels, while negative values indicate that there are more short liquidation levels.
Moreover, there were significant chunks of short liquidation levels to the north, notably at $63.66 and $64.04. $65.3 was another level that could be tested before a bearish bias.
Is your portfolio green? Check the LTC Profit Calculator
The price action and the technical indicators showed there was some possibility of a minor move higher.
The data from Hyblock agreed with these findings and laid out more precise levels where a bearish reversal could occur. If Bitcoin happens to retrace its recent move to the $29.4k level, a bearish Litecoin in the short-term can be expected.