Is LIT’s burn worth $42 million enough to spur the altcoin’s next big rally?
Demand and bullish momentum for Lighter continued to hold sway despite a bearish momentum divergence signal.



Lighter [LIT] has rallied by 3.68% in the last 24 hours with a daily trading volume spike of 13.52%. Over the past week alone, the token rallied by 18%.
In a recent report, AMBCrypto warned that the token was potentially overbought and might see a correction toward $2. Now, in the days after, LIT did fall by around 13% to reach $2.3. However, it has since climbed back to $2.60 once more.
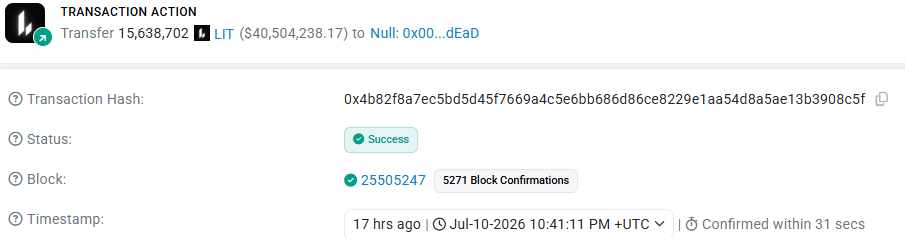
In a post on X, Lighter revealed the burn of just over 15.6 million LIT tokens, worth more than $42 million. It represented approximately 6.3% of the LIT circulating supply of 250 million tokens and 1.5% of the total supply of 1 billion.
This massive burn on 10th of July could have sparked short-term bullish momentum for the altcoin. In fact, the price action showed that a move towards $3 might not be far.
Why Lighter price trends might be overextended
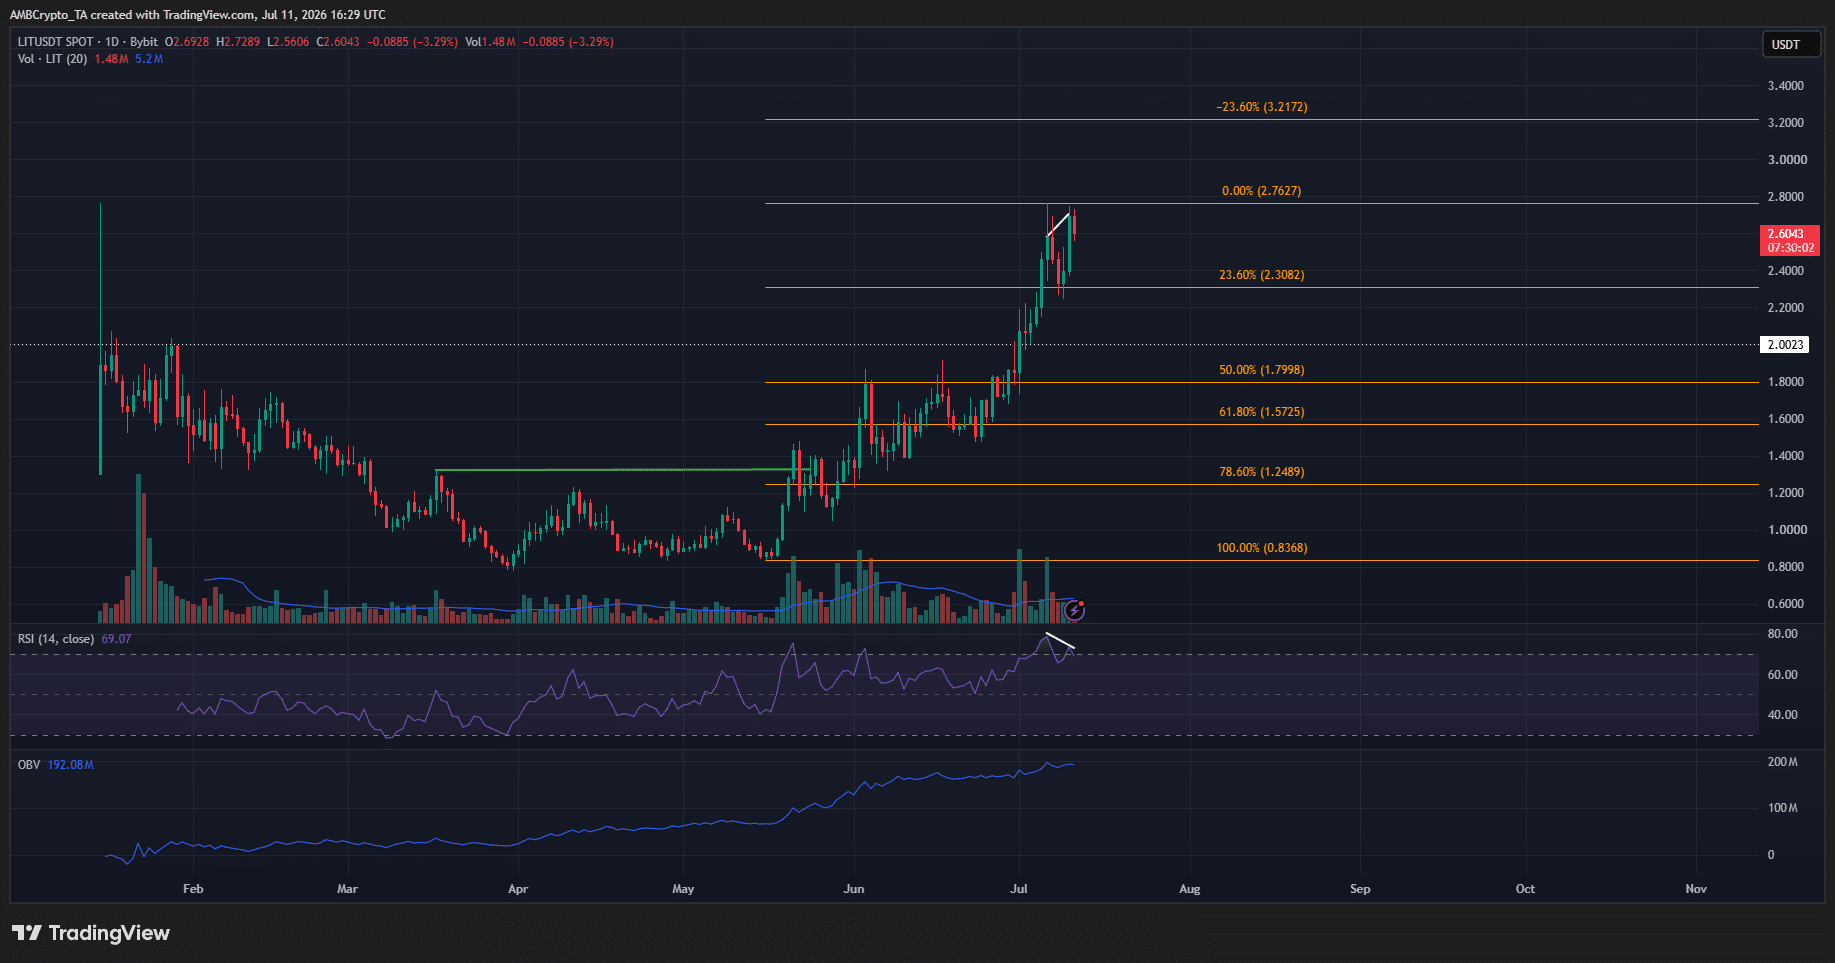
The 1-day chart revealed a bearish divergence. The RSI made a lower high while the price made a higher high, a classic bearish divergence. The volume trends were steadily bullish, but the bearish momentum divergence warned of a potential price pullback.
Despite the divergence though, demand for the altcoin has been strong.
Based on the swing move higher from $0.83 to $2.76, Fibonacci retracement levels were plotted.
If LIT falls below $2.30, the 23.6% Fibonacci retracement level, swing traders and investors can wait for a deeper retracement. Patience is required until then.
Traders’ call to action – Play the range
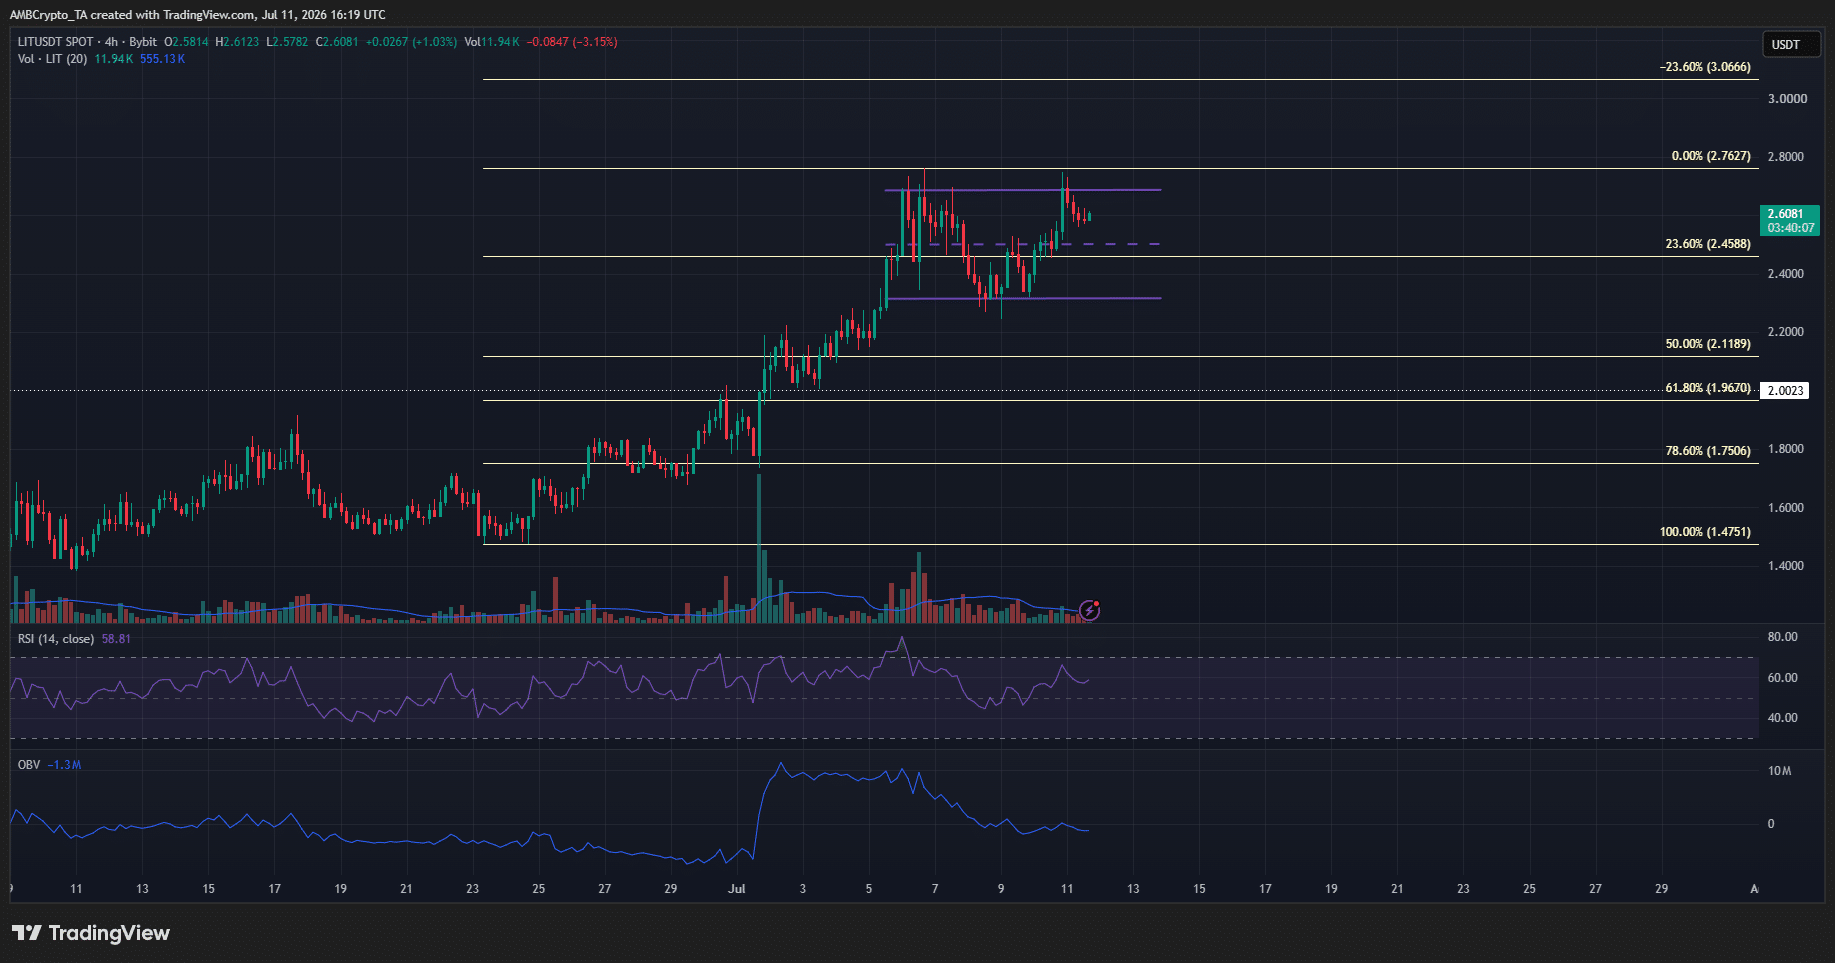
The 1-day chart warned of a pullback. The 4-hour chart showed a range formation between $2.31 and $2.68 form. Neither extreme of the range has been breached so far after two tries in July.
Traders can wait for a bullish breakout past $2.70 to buy LIT, targeting $3.06 and $3.21. On the other hand, a breakdown below the $2.31 range low, and the 23.6% Fibonacci retracement level on the 1-day timeframe at $2.30, would indicate a pullback below $2 was becoming more likely.
Final Summary
- Demand and bullish momentum for Lighter continued to hold sway, despite a bearish momentum divergence signal.
- Traders would want to watch the short-term range formation for clues on the next impulse move’s direction.