
Galaxy Digital sells $9B in BTC, but Bitcoin quickly recovers – Here’s how

- The 50% retracement level and the daily RSI indicated a possible range formation.
- The rising buying pressure and the liquidation heatmap gave opposing signals.
Pepe [PEPE] struggled to break out past a local resistance level. The memecoin showed signs of forming a range, but a bullish chart pattern is also a viable scenario, according to a previous AMBCrypto report.
The on-chain metrics showed that the selling pressure might rise in the coming days, the report added.
To find out which path is more likely for PEPE, the liquidation levels data was investigated alongside technical analysis.
The key long-term Fibonacci retracement level has been defended
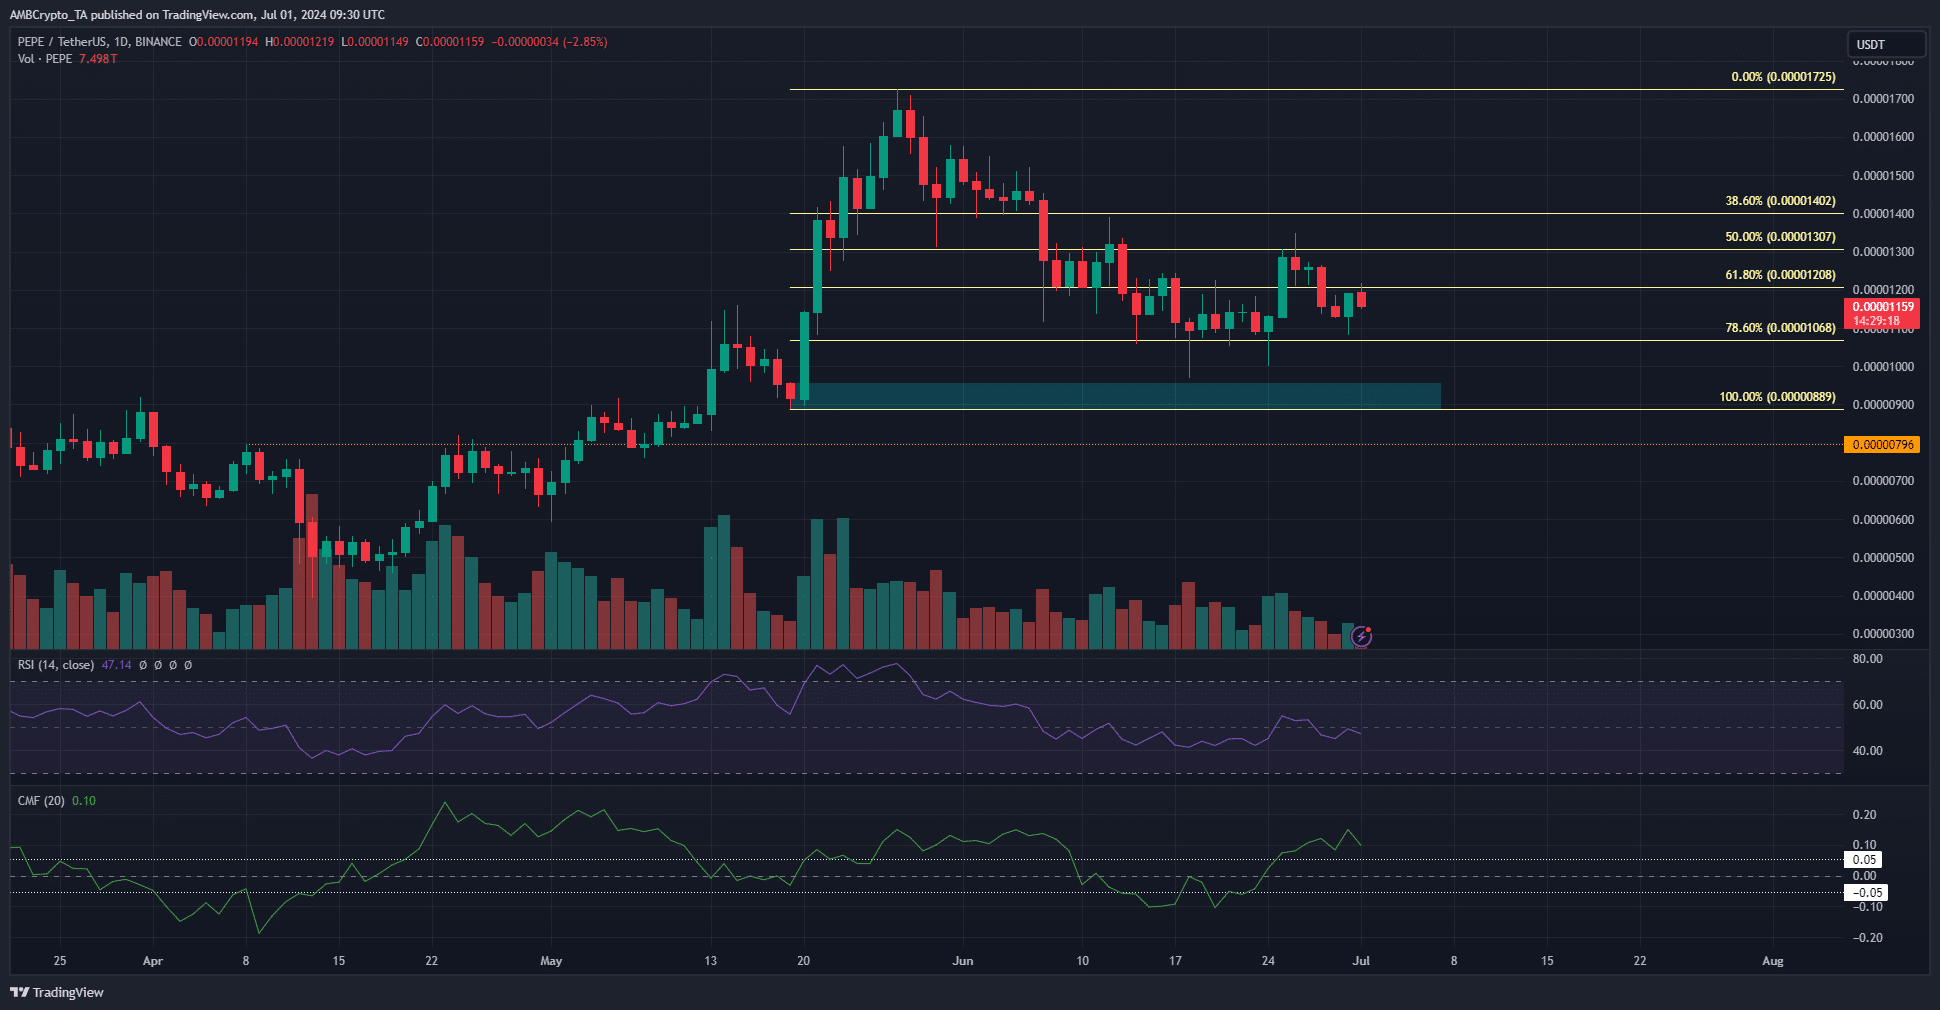
Source: PEPE/USDT on TradingView
During the retracement in the second half of May, the selling pressure began to get intense. In mid-June, the CMF fell below -0.05 to signal hefty capital outflows.
It was anticipated at that time that PEPE prices would retrace the entire mid-May rally and fall to $0.0000089.
The bulls ensured that this did not happen and valiantly defended the 78.6% retracement level at $0.0000107. Yet, they were not strong enough to force a breakout past the 50% retracement level at $0.000013.
The CMF was also back above the +0.05 level, but the daily RSI was sluggish. It meandered around the neutral 50 mark and did not yet signal a bullish shift in momentum.
Should traders prepare for another PEPE price slump?
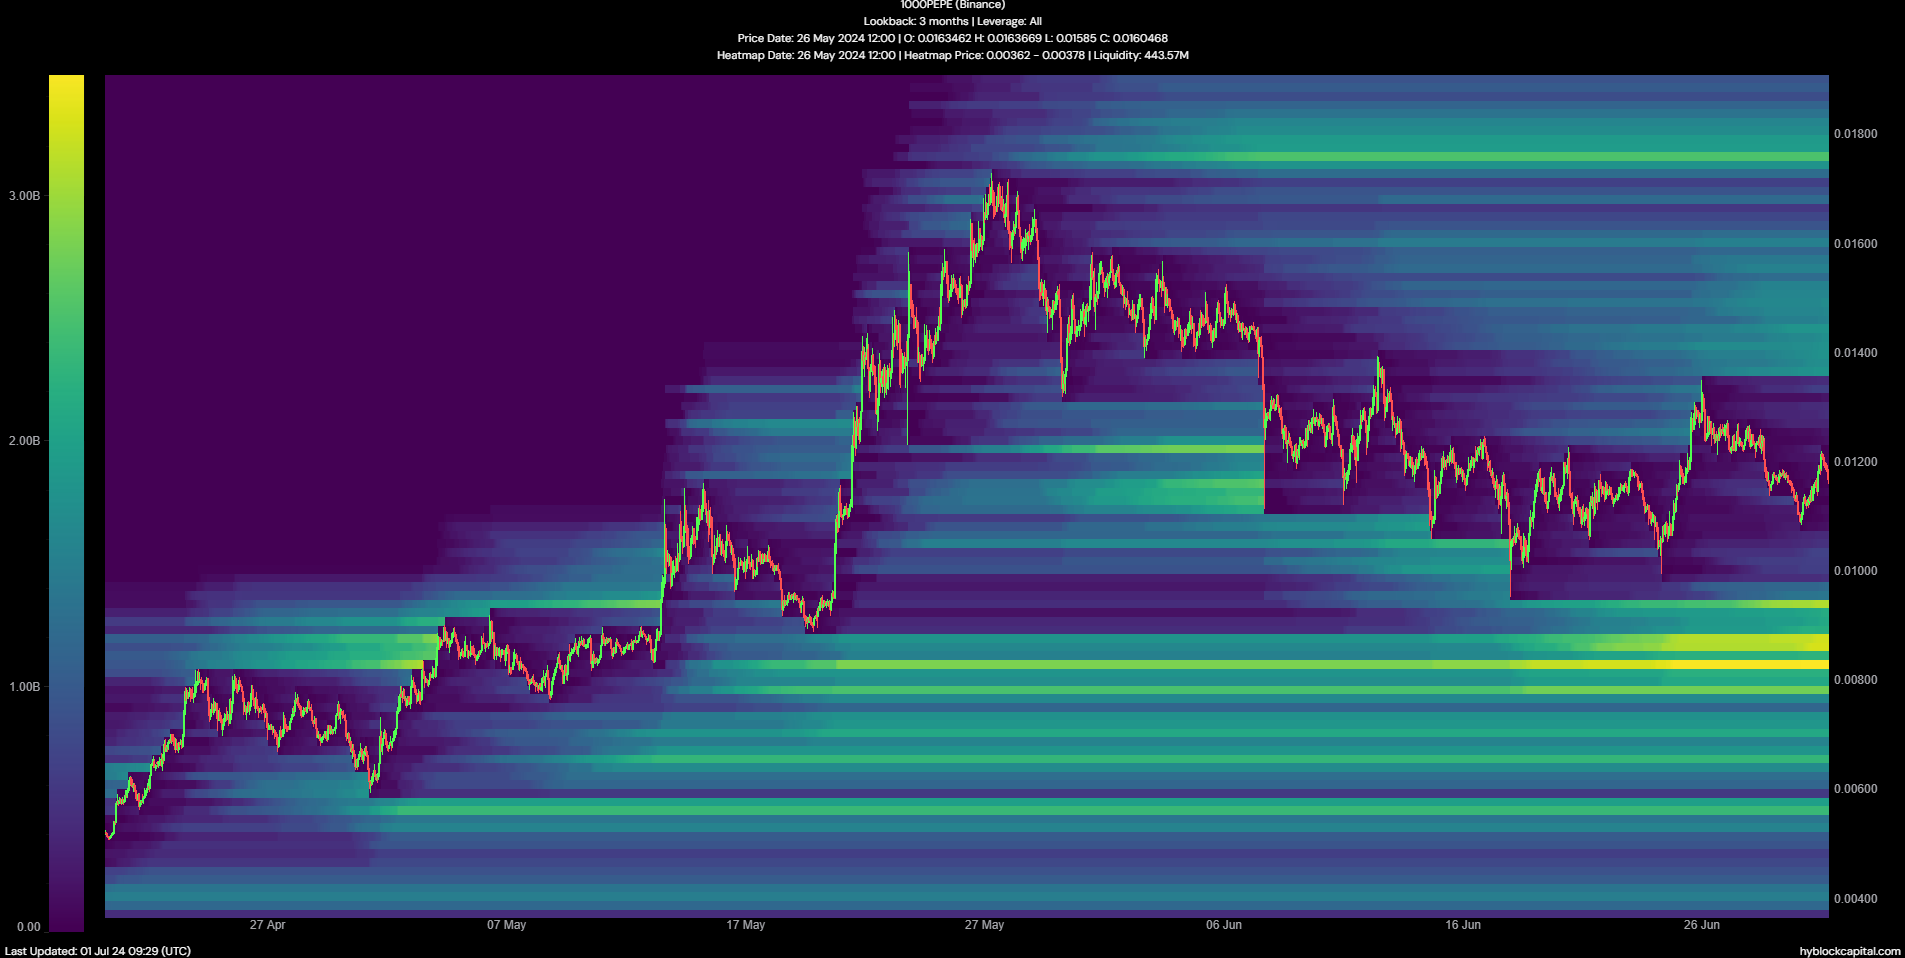
Source: Hyblock
The liquidation heatmap data of the past three months noted that the $0.000008-$0.000009 zone had a large cluster of liquidation levels.
They could attract prices to them like a magnet, especially since the 50% Fib retracement level continued to serve as a strong barrier.
Not every liquidity cluster is guaranteed to be visited. If the bulls establish themselves in the coming weeks, the $0.000018 zone would be the next liquidity target.
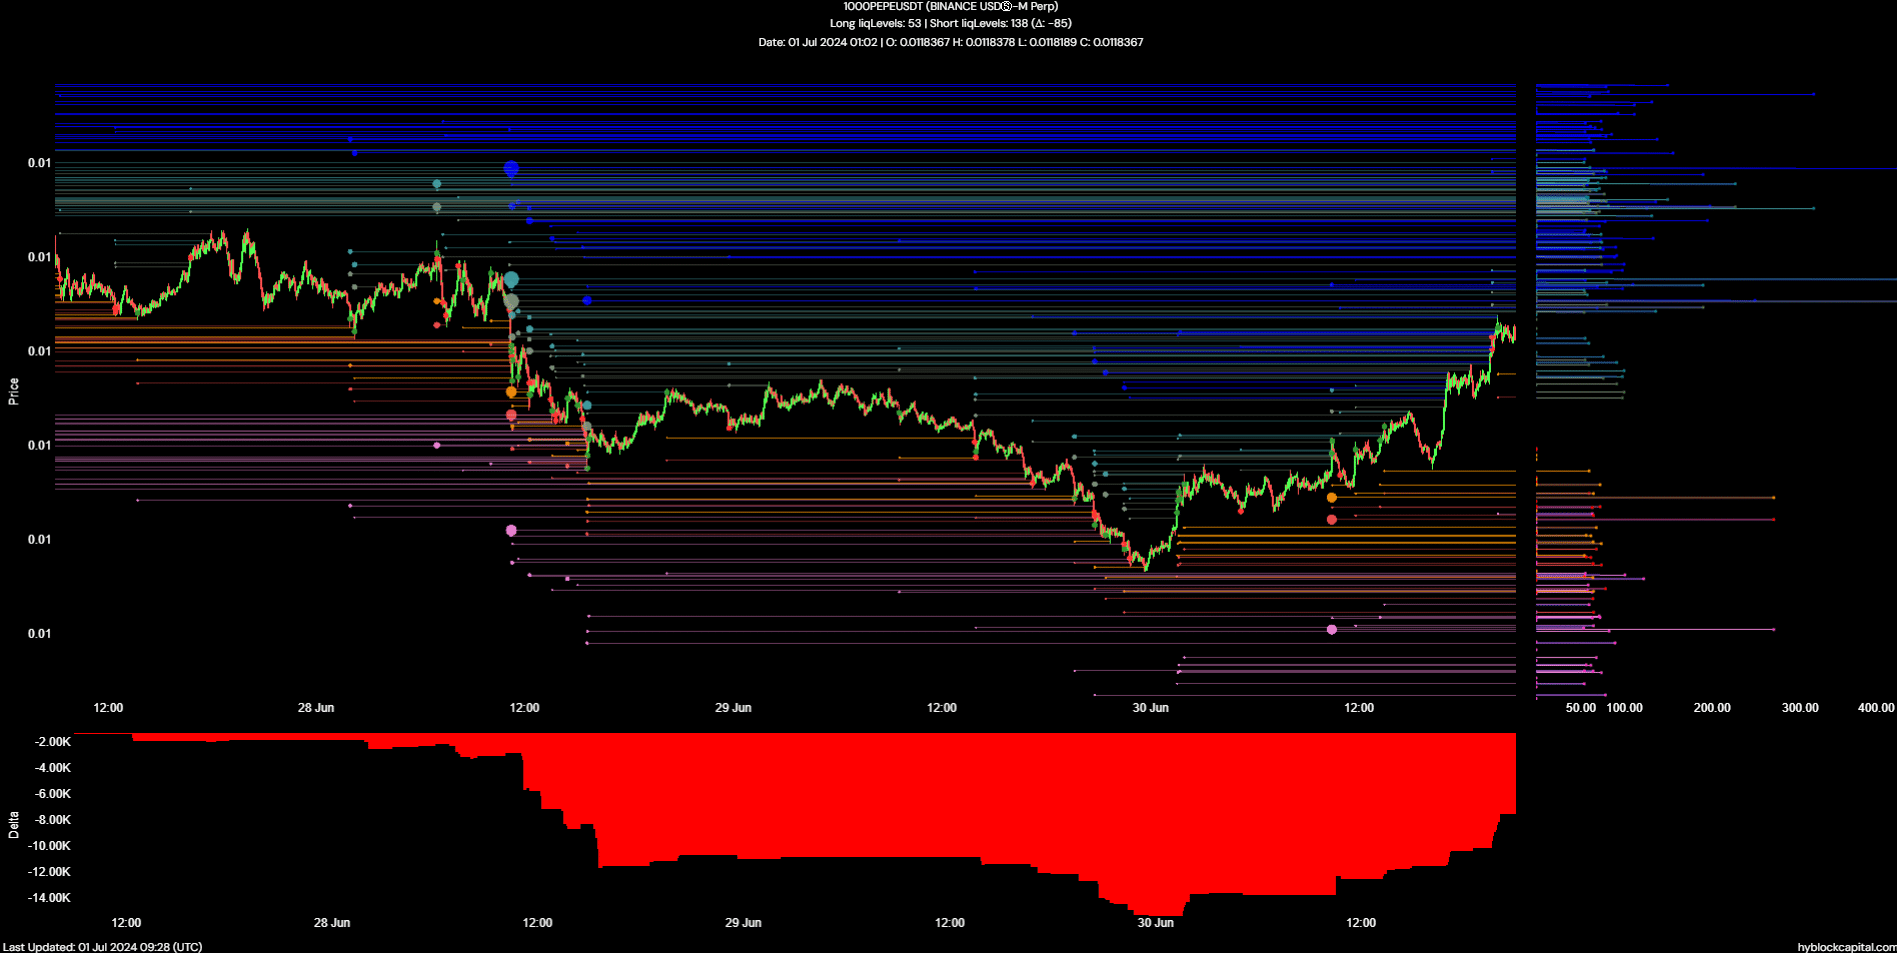
Source: Hyblock
Realistic or not, here’s PEPE’s market cap in BTC’s terms
The liquidation levels of the past two days showed that short positions far outnumbered the long positions. This meant that a price bounce to squeeze these short positions was likely.
The next large pockets of liquidity in the short-term are at $0.0000122 and $0.0000134.
Disclaimer: The information presented does not constitute financial, investment, trading, or other types of advice and is solely the writer’s opinion.


