Ripple
Is XRP poised for a new rally this week? Find out here!
A long-term bullish pattern appeared on XRP’s chart, and the token managed to breakout successfully, hinting at a massive bull rally ahead.
- XRP has been consolidating inside the bull pattern since last year.
- The token might retest the pattern before beginning a bull rally.
The crypto market somewhat turned sluggish in the last 24 hours as there was no major price movement, and XRP was not an exception.
However, this just might be the calm before a storm as a long-term bullish pattern appeared on XRP’s weekly price chart, which could result in a massive bull rally.
XRP’s bullish breakout
CoinMakretCap’s data revealed that XRP’s price only managed to move marginally in the past week. At the time of writing, XRP was trading at $0.6024 with a market capitalization of over $33 billion, making it the seventh largest crypto.
AMBCrypto’s analysis of XRP’s weekly chart revealed a long-term descending channel pattern.
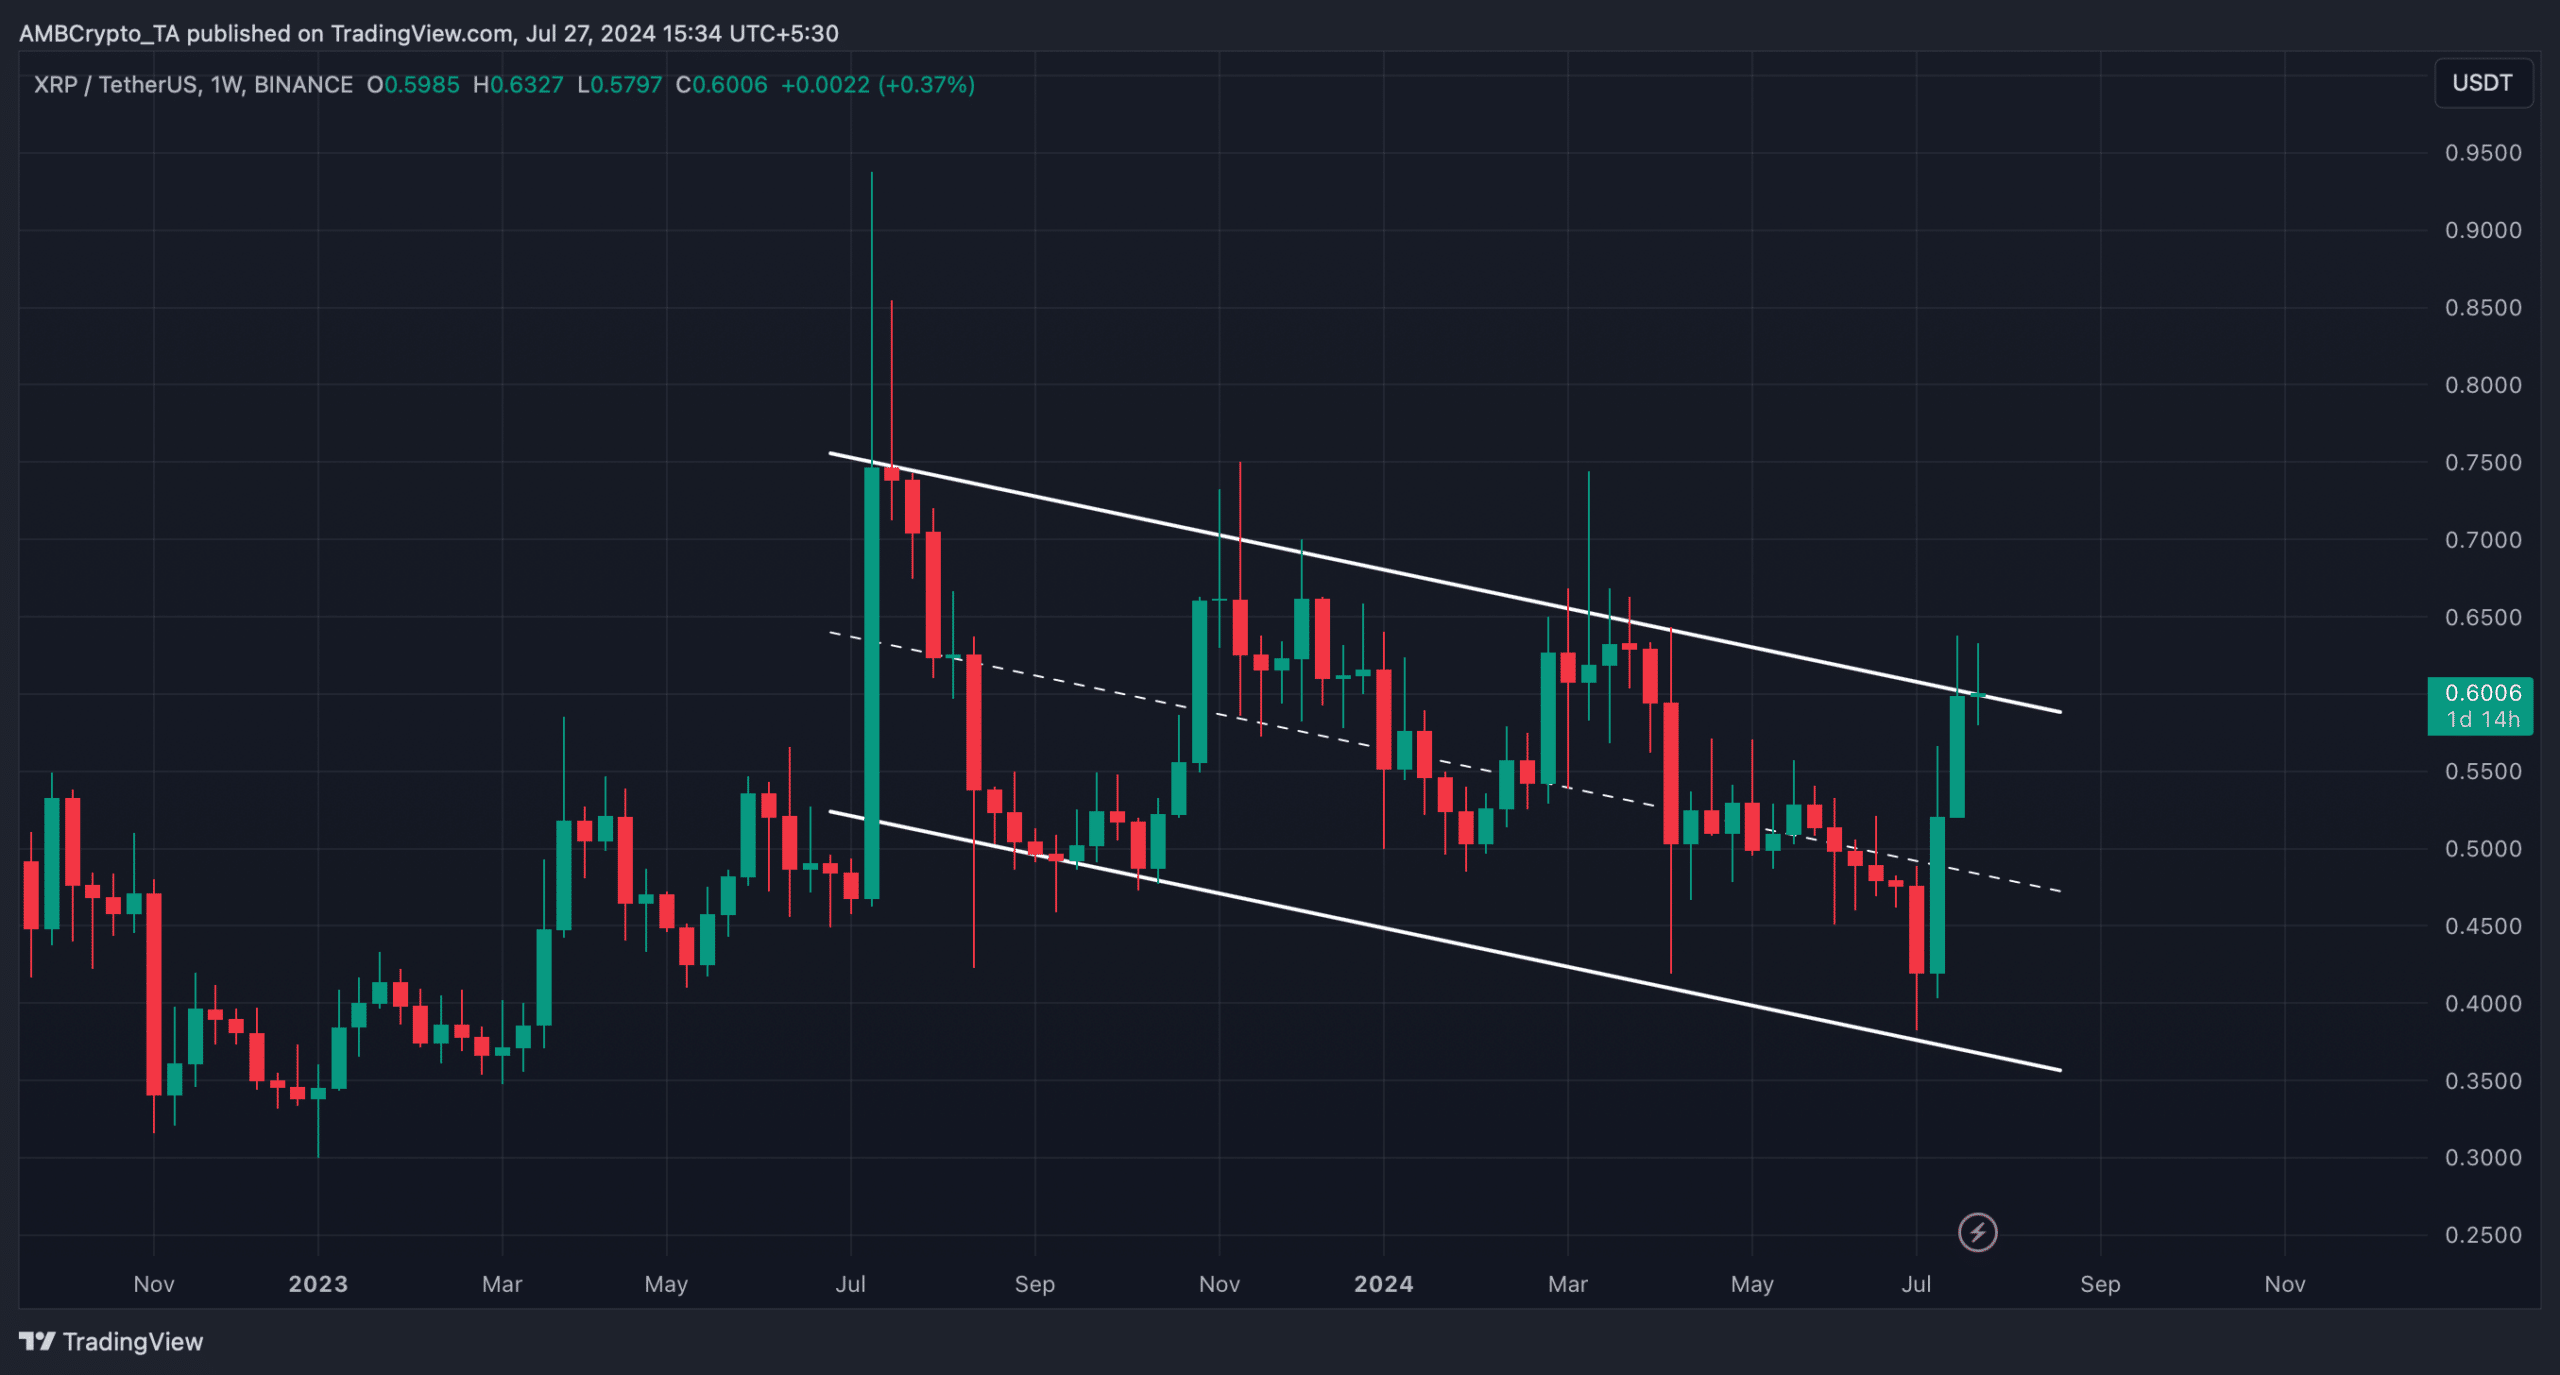
Source: TradingView
The pattern emerged on the token’s weekly chart last year in July, and since then its price has been consolidating inside the pattern.
The better news was that at the time of writing, XRP had broken above that pattern. If the pattern tests, then investors might witness the token might retest its 2023 highs in the coming months.
Will XRP begin a bull rally?
AMBCrypto then took a look at XRP’s on-chain data to see whether they backed the possibility of a fresh bull rally. As per our analysis of Santiment’s data, XRP’s trading volume declined while its price dropped.
This suggested that investors were reluctant to trade XRP at a lower price.
Additionally, its supply on exchanges continued to drop, suggesting that buying pressure remained high. However, the concerning metric was the MVRV ratio, which dropped, hinting that price will plummet.
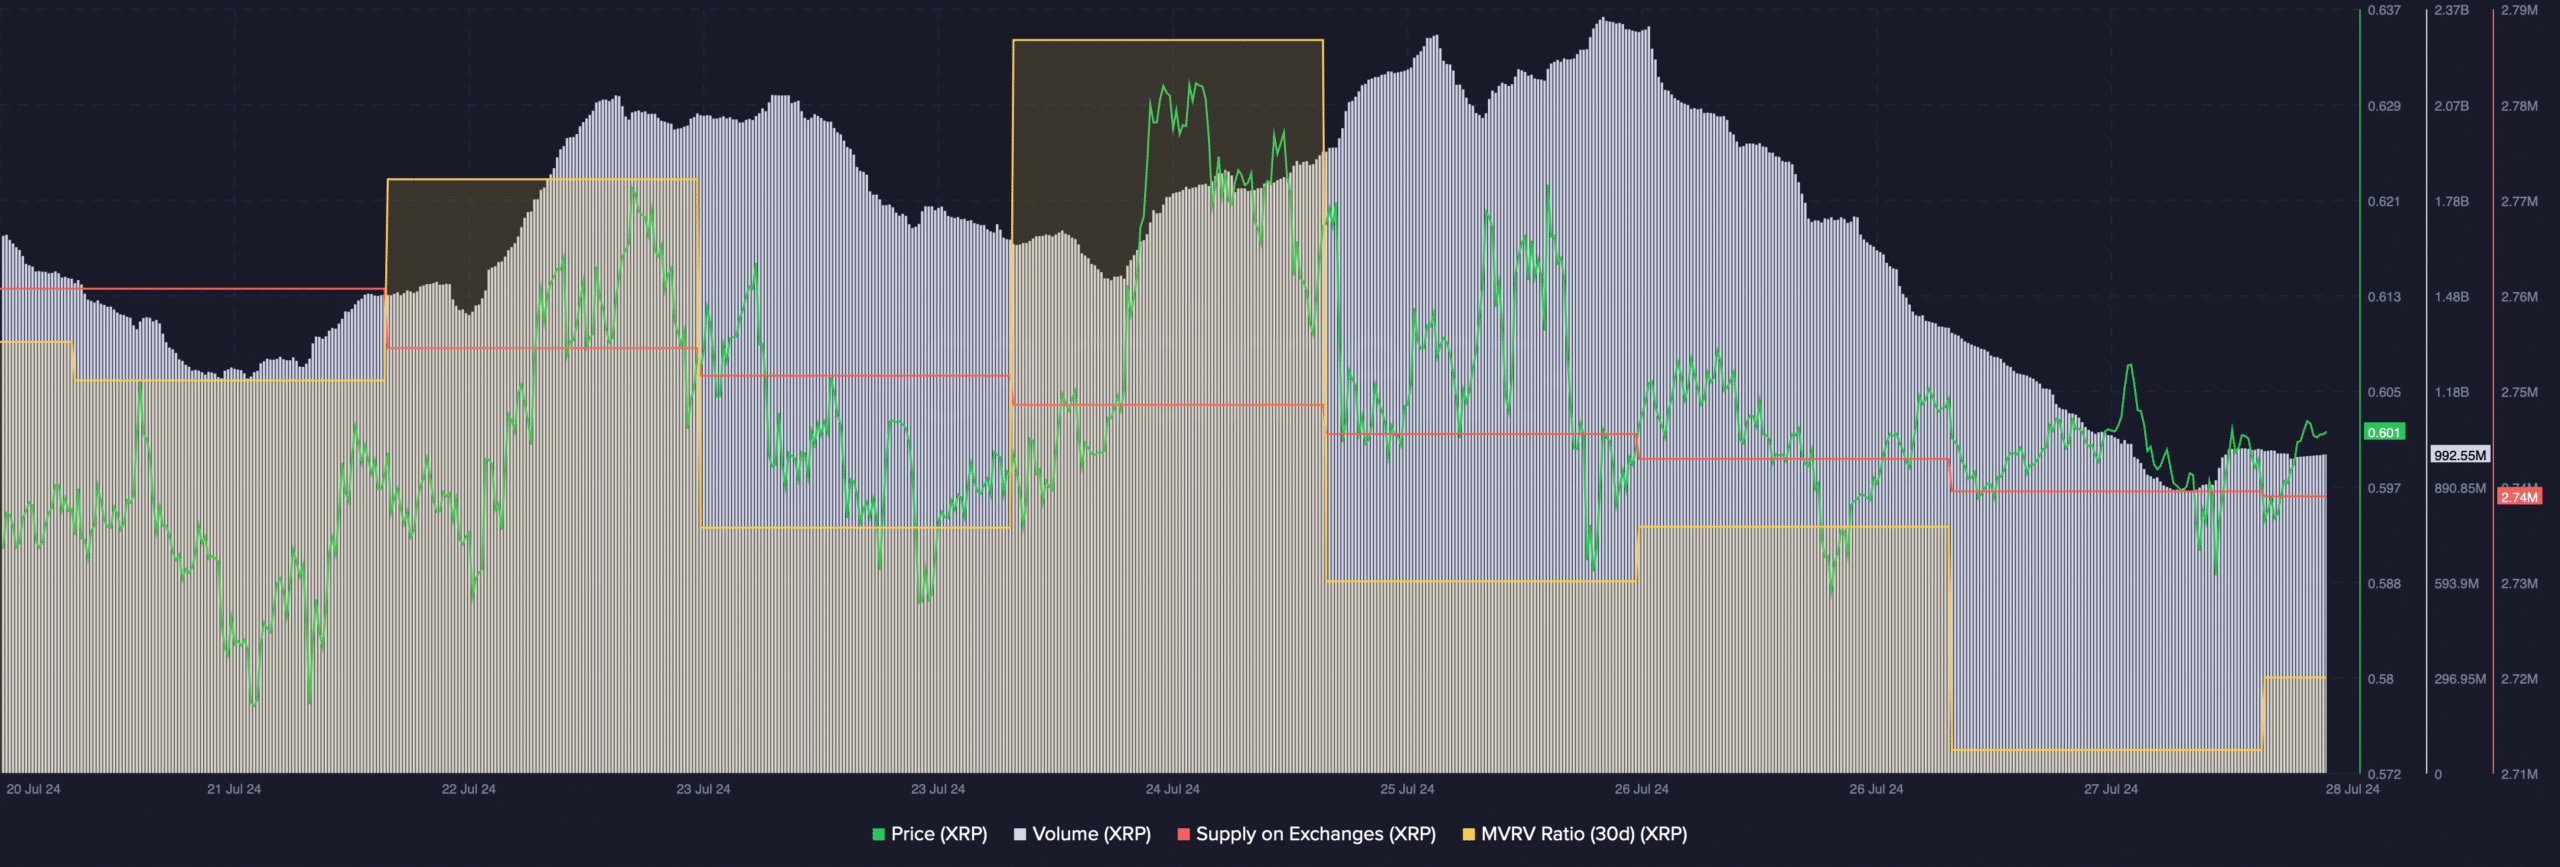
Source: Santiment
Additionally, at the time of writing, XRP’s fear and greed index had a value of 62%, meaning that the market was in a “greed” phase.
Whenever the metric hits this level, it indicates that the chances of a price correction are high. Like the aforementioned metrics, most market indicators also looked bearish.
For instance, the Relative Strength Index (RSI) registered a downtick. A similar declining trend was also noted on the Chaikin Money Flow’s (CMF) graph.
Read Ripple’s [XRP] Price Prediction 2024-25
Moreover, the token’s price had touched and retracted from the upper limit of the Bollinger Bands.
However, investors shouldn’t lose hope yet, as these metrics and indicators might just be suggesting a retest on the bullish breakout. If that’s true, then XRP’s would begin a bull rally in the following days.
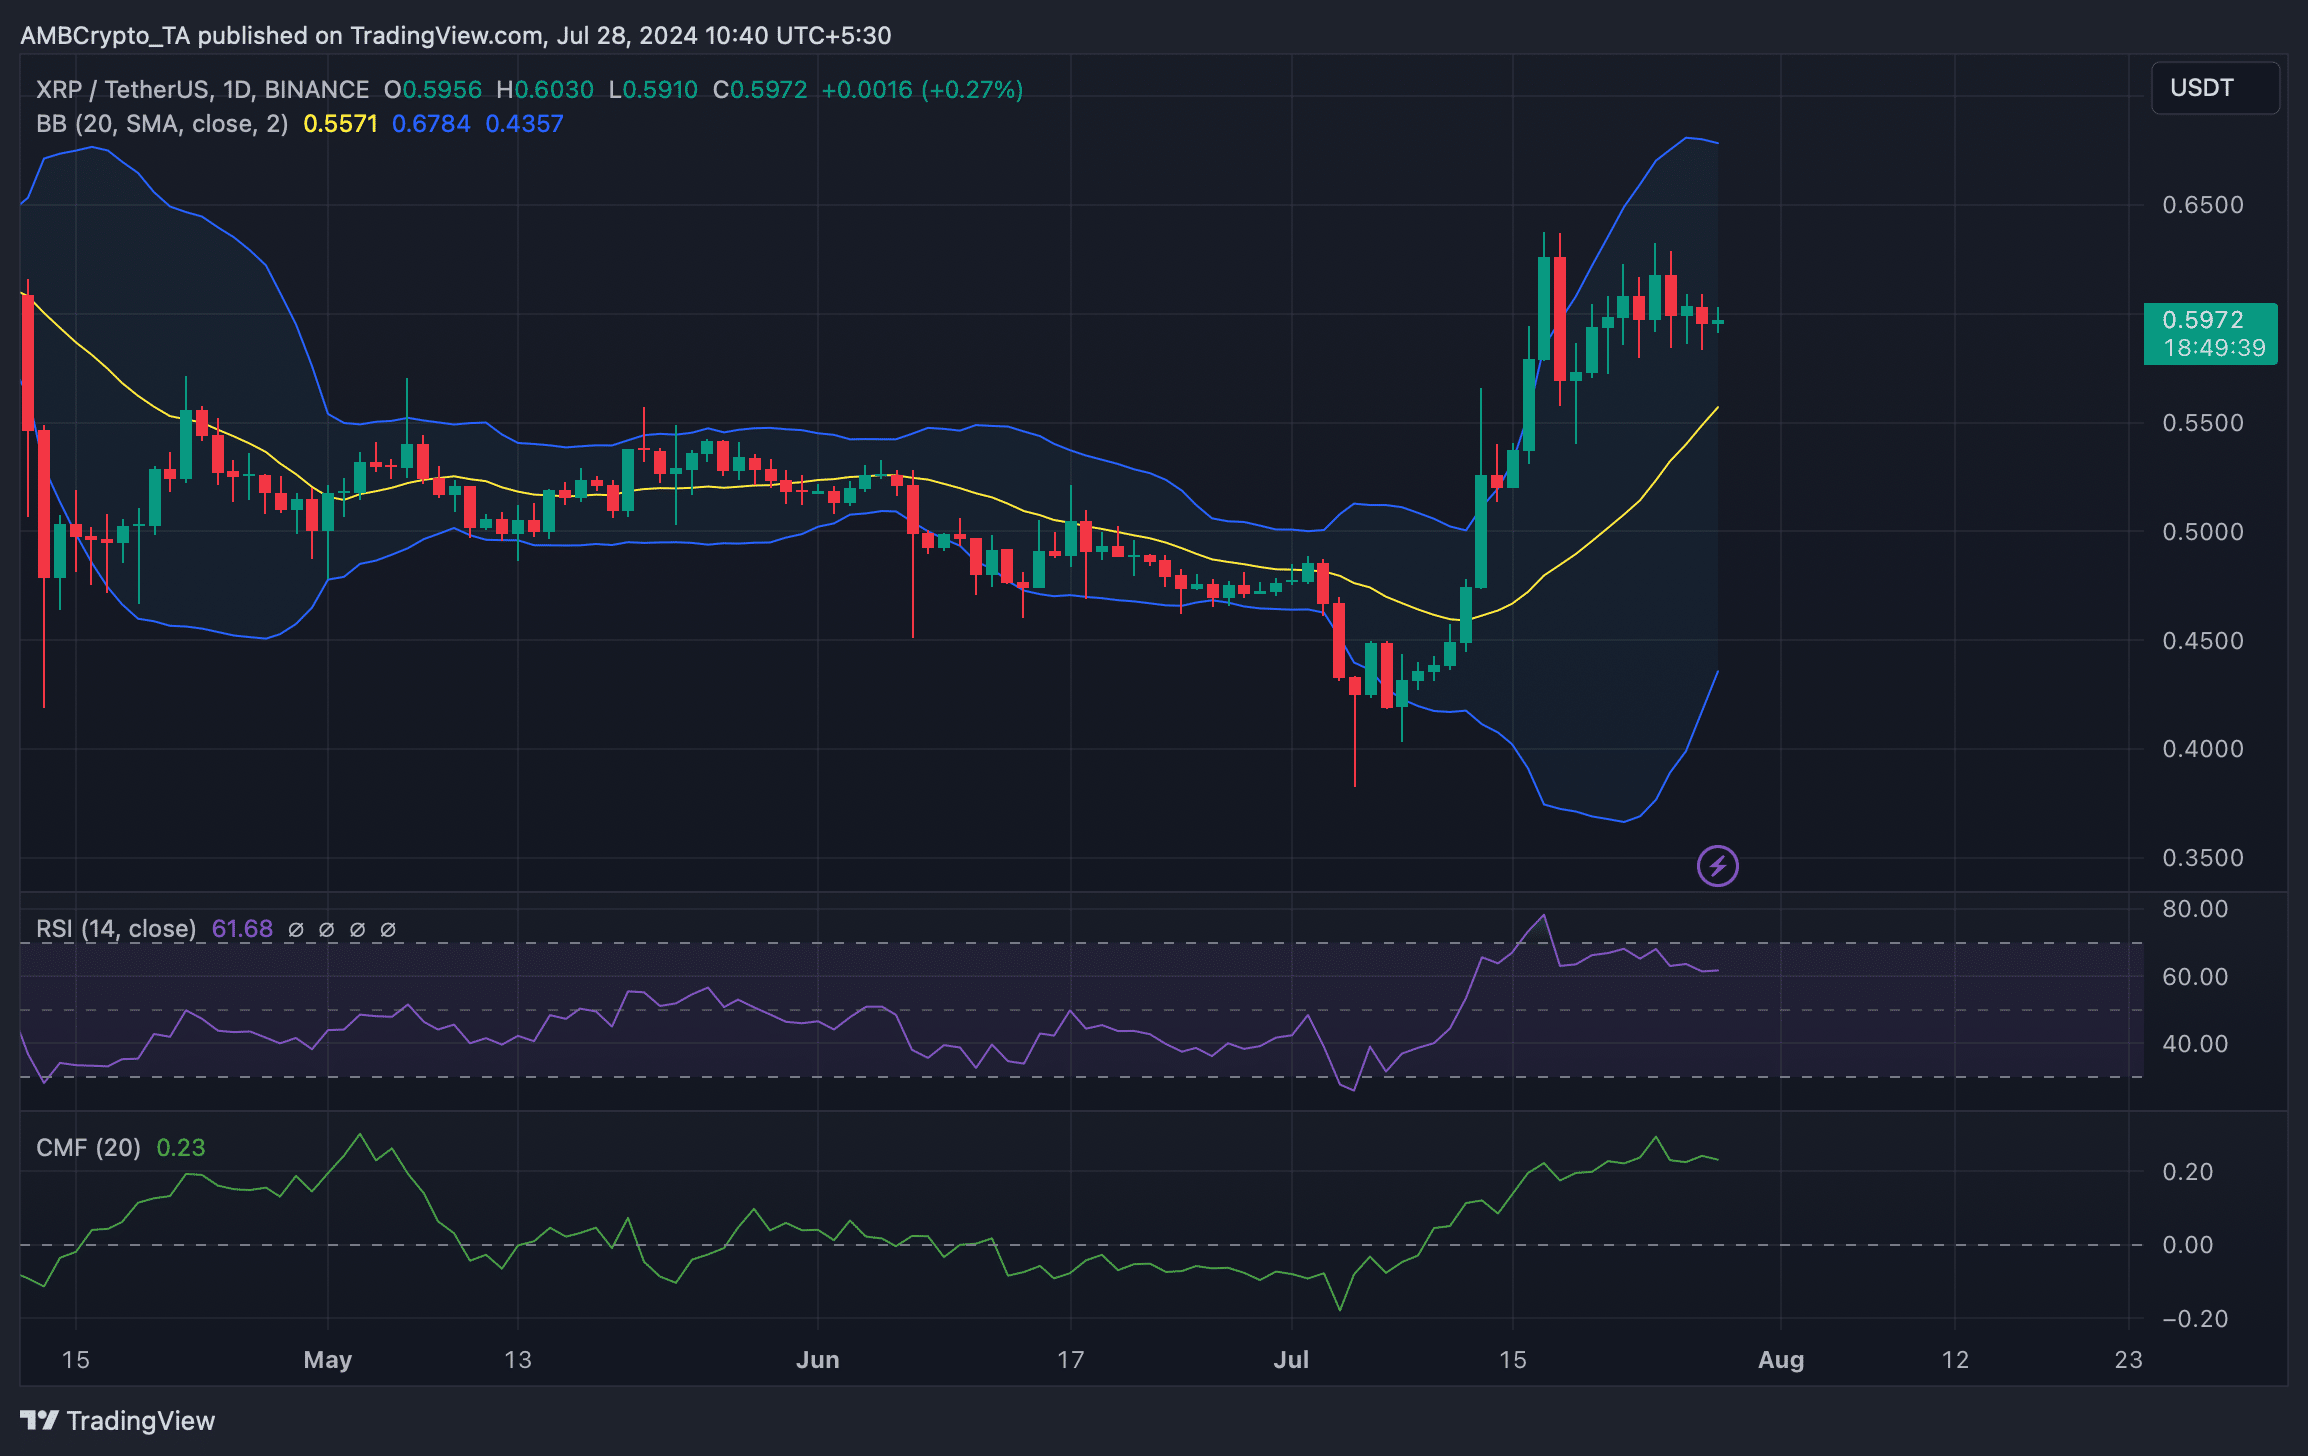
Source: TradingView