
- Following a misleading breakout from its consolidation channel, SOL has encountered increased selling pressure.
- A ‘death cross’ observed in the Moving Average Convergence Divergence (MACD) indicator signals a heightened risk of a continued downtrend.
The Solana [SOL] market has shifted back to red, posting a 2.49% loss in the last 24 hours, accompanied by a spike in trading volume. This combination suggests that the market may continue to weaken.
AMBCrypto analyzed whether this bearish sentiment is a short-term fluctuation or if it is likely to extend over a longer timeframe.
Consolidation channel can lead to a price drop
Solana has been trading within a consolidation channel on the 4-hour timeframe since the beginning of September.
This pattern is characterized by price movements oscillating within narrow boundaries, as traders await clear signals for the next potential breakout—either upward or downward.
Although SOL briefly exceeded the upper boundary of the consolidation channel, reaching a high of 139.80, it has since fallen back within the channel limits.
Such movement is termed a ‘fakeout,’ indicating that the price is likely to move in the opposite direction. For Solana, this suggests a potential downward trajectory.
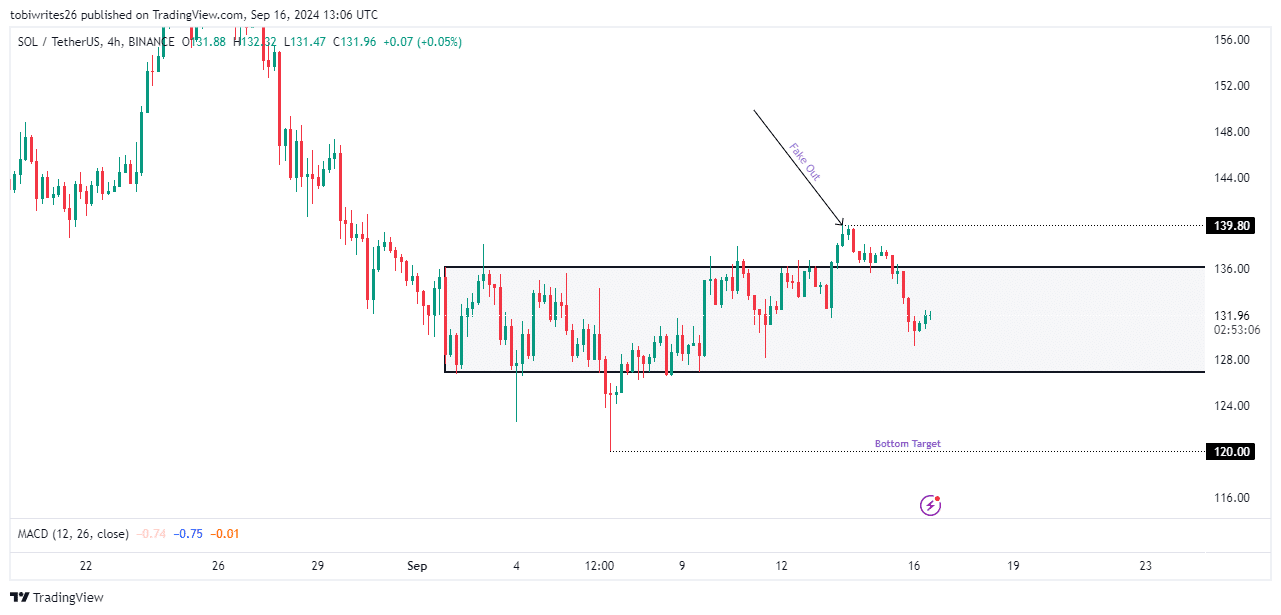
Source: Trading View
If the downward pressure persists, SOL may break below the channel and could potentially target the liquidity cluster identified at 120.00.
Technical indicators suggest a bearish outlook for SOL
The Moving Average Convergence and Divergence (MACD), highlighted by a yellow circle, indicates a ‘death cross’ where the blue MACD line has crossed below the orange signal line.
This crossover signals a bearish trend, as it suggests that market participants are more inclined to sell rather than hold or buy more SOL.
Additionally, the Relative Strength Index (RSI) supports a bearish perspective. At the time of writing, the RSI stands at 41.29, which is below the neutral 50 mark, indicating a downtrend. A further decline in the RSI could imply that SOL will experience additional losses.
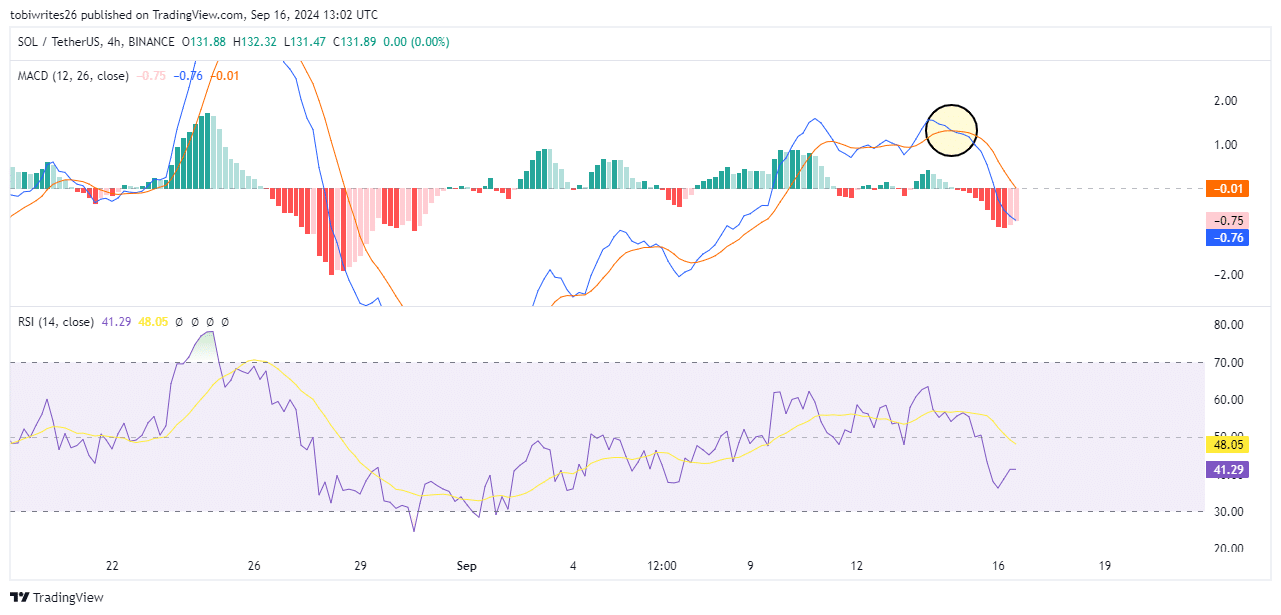
Source: Trading View
The MACD is a trend-following momentum indicator used to identify potential changes in market direction, while the RSI is a momentum oscillator that measures the speed and change of price movements, identifying overbought and oversold conditions to help predict potential price reversals.
The broader market outlook for SOL remains bullish
Analysis of the weekly timeframe chart reveals that SOL is currently trading within a consolidation phase akin to the pattern observed before it reached an all-time high in 2021.
Read Solana’s [SOL] Price Prediction 2024-25
Should SOL break out of its current consolidation phase, it will potentially achieve a new all-time high, replicating its 2021 performance.
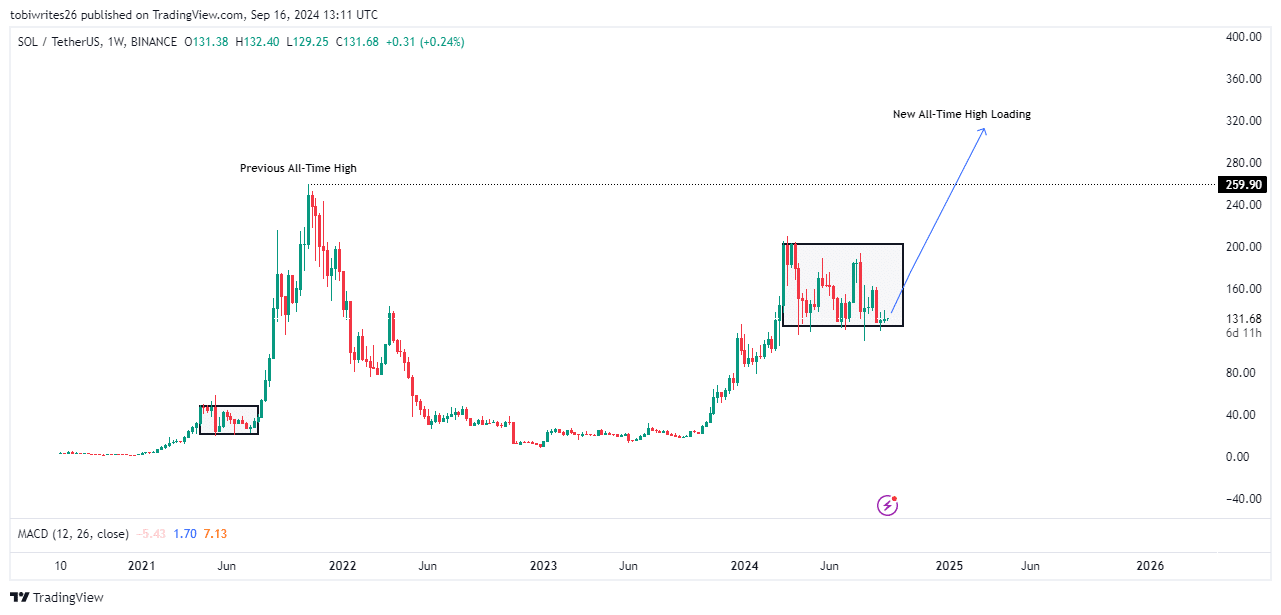
Source: Trading View
While short-term indicators suggest a bearish momentum, the broader perspective indicates that SOL is gearing up for a significant rally.


![Ethereum's [ETH] 11% rebound - Is greed fueling a bottom or is fear driving a trap?](https://ambcrypto.com/wp-content/uploads/2025/04/Ritika-8-400x240.webp)