Is Solana set to outperform Ethereum by 140%? – Yes, says this expert
Here's why Brandt believe SOL investors could be up for more profits than ETH counterparts.

- Brandt expected SOL to outshine ETH by an extra 30-140% in the long run.
- Galaxy Digital reportedly swapped $105M ETH to SOL.
Solana [SOL] reclaimed $150, bringing its recovery gains to 58% from a low of $95 hit three weeks ago.
For Ethereum [ETH] investors, they were up 30% over the same period, giving SOL counterparts a strong lead.
SOL to outshine ETH?
According to renowned trader Peter Brandt, the above SOL relative outperformance against ETH could extend to 90% in the mid or long term.
He cited the Cup and Handle (C&H) pattern, typically considered bullish, for his projection.
“This C&H is still playing out, by the way. SOL has lots of room to gain on its invalid cousin, $ETH.”
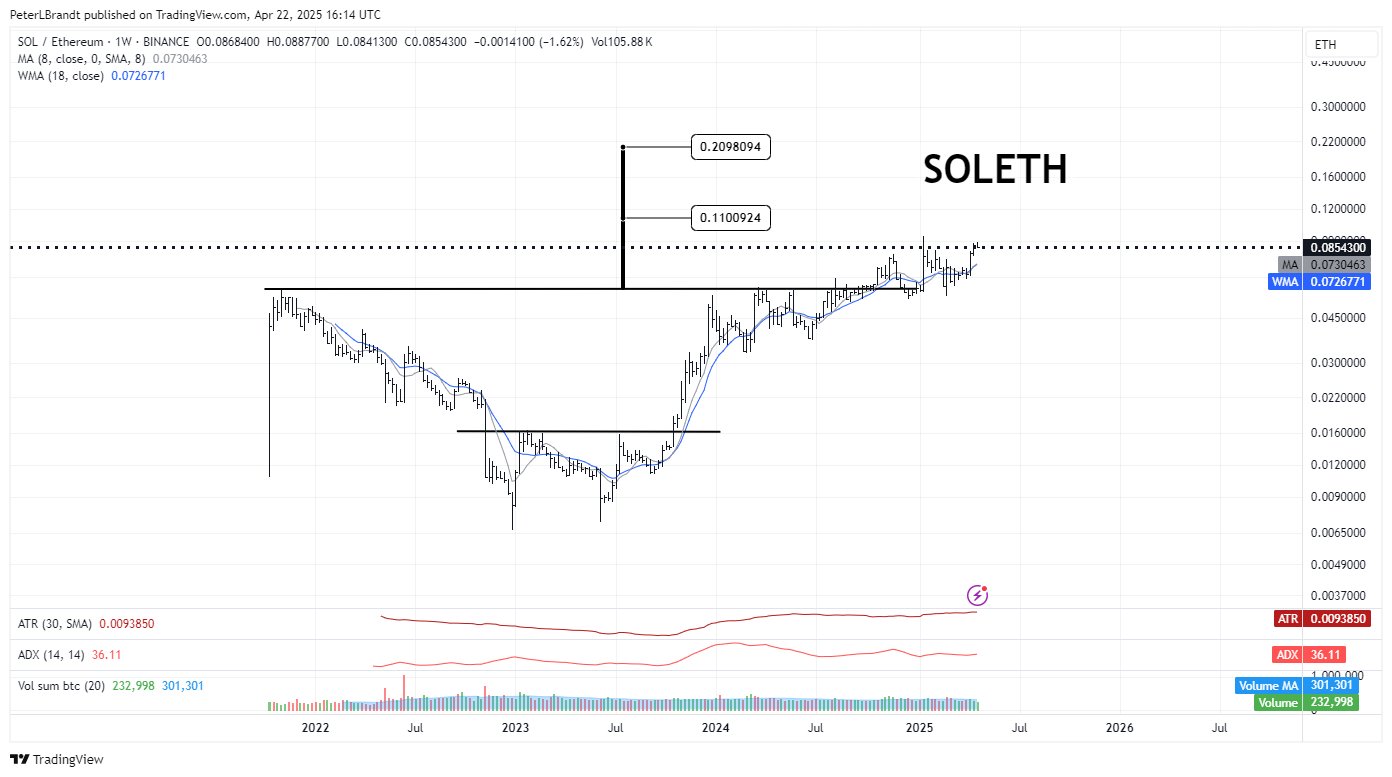
Brandt’s chart showed that, if validated, the SOL/ETH ratio, which tracks relative SOL price performance to ETH, could hit 0.11 or 0.20. This suggested a potential 90% or 245% rally from the breakout level of 0.05.
The SOL/ETH ratio was valued at 0.08. This meant SOL/ETH had an extra growth room to rally 33% and 140%, respectively, if Brandt’s targets were to be hit.
Simply put, SOL could outperform ETH by 30-140% in the long run.
Galaxy dumps ETH for SOL
Interestingly, the likely investor shift from ETH to SOL appeared to be in play among large players.
According to Wu Blockchain, citing Arkham Intelligence data, Galaxy Digital swapped $105 million ETH for SOL on Binance.
“Galaxy Digital has transferred 65,600 ETH (approximately $105 million) to Binance over the past two weeks, while withdrawing 752,240 SOL (approximately $98.37 million) from the exchange, suggesting a possible ETH-to-SOL swap.”
Brandt’s projection could be validated faster if the trend continued and more players followed suit.

SOL’s market recovery reflects organic spot demand, highlighted by the Cumulative Volume Delta (CVD) Spot indicator uptick.
The rally shows signs of sustainability, fueled by both spot and derivative demand, evident in the Open Interest spike.
On the 3-day price chart, the next key level stands at $160, serving as both an overhead hurdle and a moving average.
For the uptrend to continue, SOL must decisively break above the RSI neutral level. Failure to do so could lead to a retest of $136, keeping traders cautious.