Solana
Is Solana’s comeback on? Here’s the case for SOL’s price to $250!
Solana’s latest hike has put it in a good position. Is it out of the woods though?
- Solana’s hike positioned it at critical resistance levels, with potential for a bullish breakout towards $250
- Key support and resistance levels, along with derivatives data, pointed to a cautiously optimistic trend
Solana (SOL) seems to be at the forefront of the crypto-market’s recovery following a significant downturn on the charts. In fact, Solana, at press time, was demonstrating a bullish trend, trading at around $153.45 following a major hike.
This hike is significant for traders and investors monitoring key support and resistance levels.
SOL’s price movement is being closely watched, with three critical levels identified on the chart – $123.20 as a major support, $160.00 as an intermediate resistance, and $206.00 as a significant resistance. These levels are crucial for predicting SOL’s next potential targets.
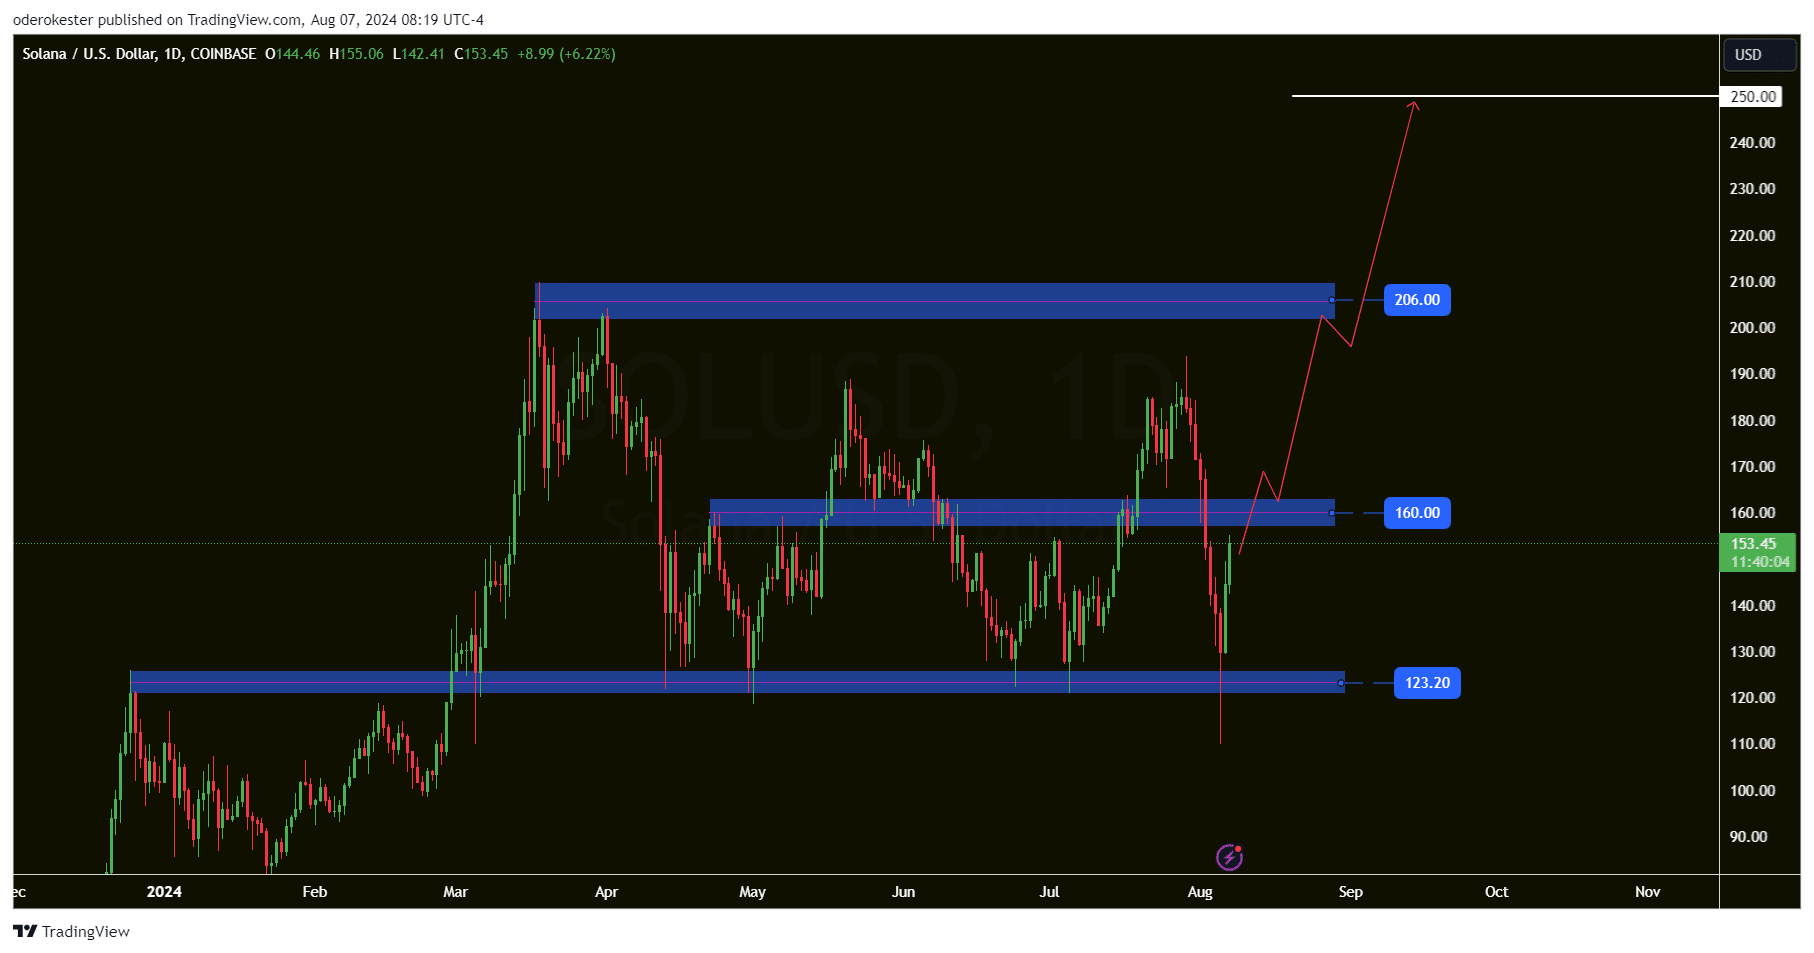
Source: TradingView
If SOL continues its upward trajectory and breaks above the $160-resistance, it may face a challenge around the $206-mark. A breakout above $206 could indicate a strong bullish trend, potentially pushing SOL towards a target of $250.
Now, this scenario would require sustained buying momentum and positive market sentiment. Traders are therefore advised to look for volume confirmation on these breakouts to validate the strength of the move.
Technical indicators and market sentiment
According to Ali Martinez’s comment on X,
“The TD Sequential indicator is now showing a sell signal on the #Solana hourly chart, suggesting a potential dip to $135-$130. However, breaking the risk line at $146 would invalidate this signal, potentially driving $SOL up to $150-$166.”
The Fibonacci retracement levels on the chart support this outlook, with the 0.236-level at $135.21 and the 0.382-level at $129.98 acting as possible support zones. Traders might anticipate some consolidation or a pullback in these areas if the sell signal plays out as predicted.
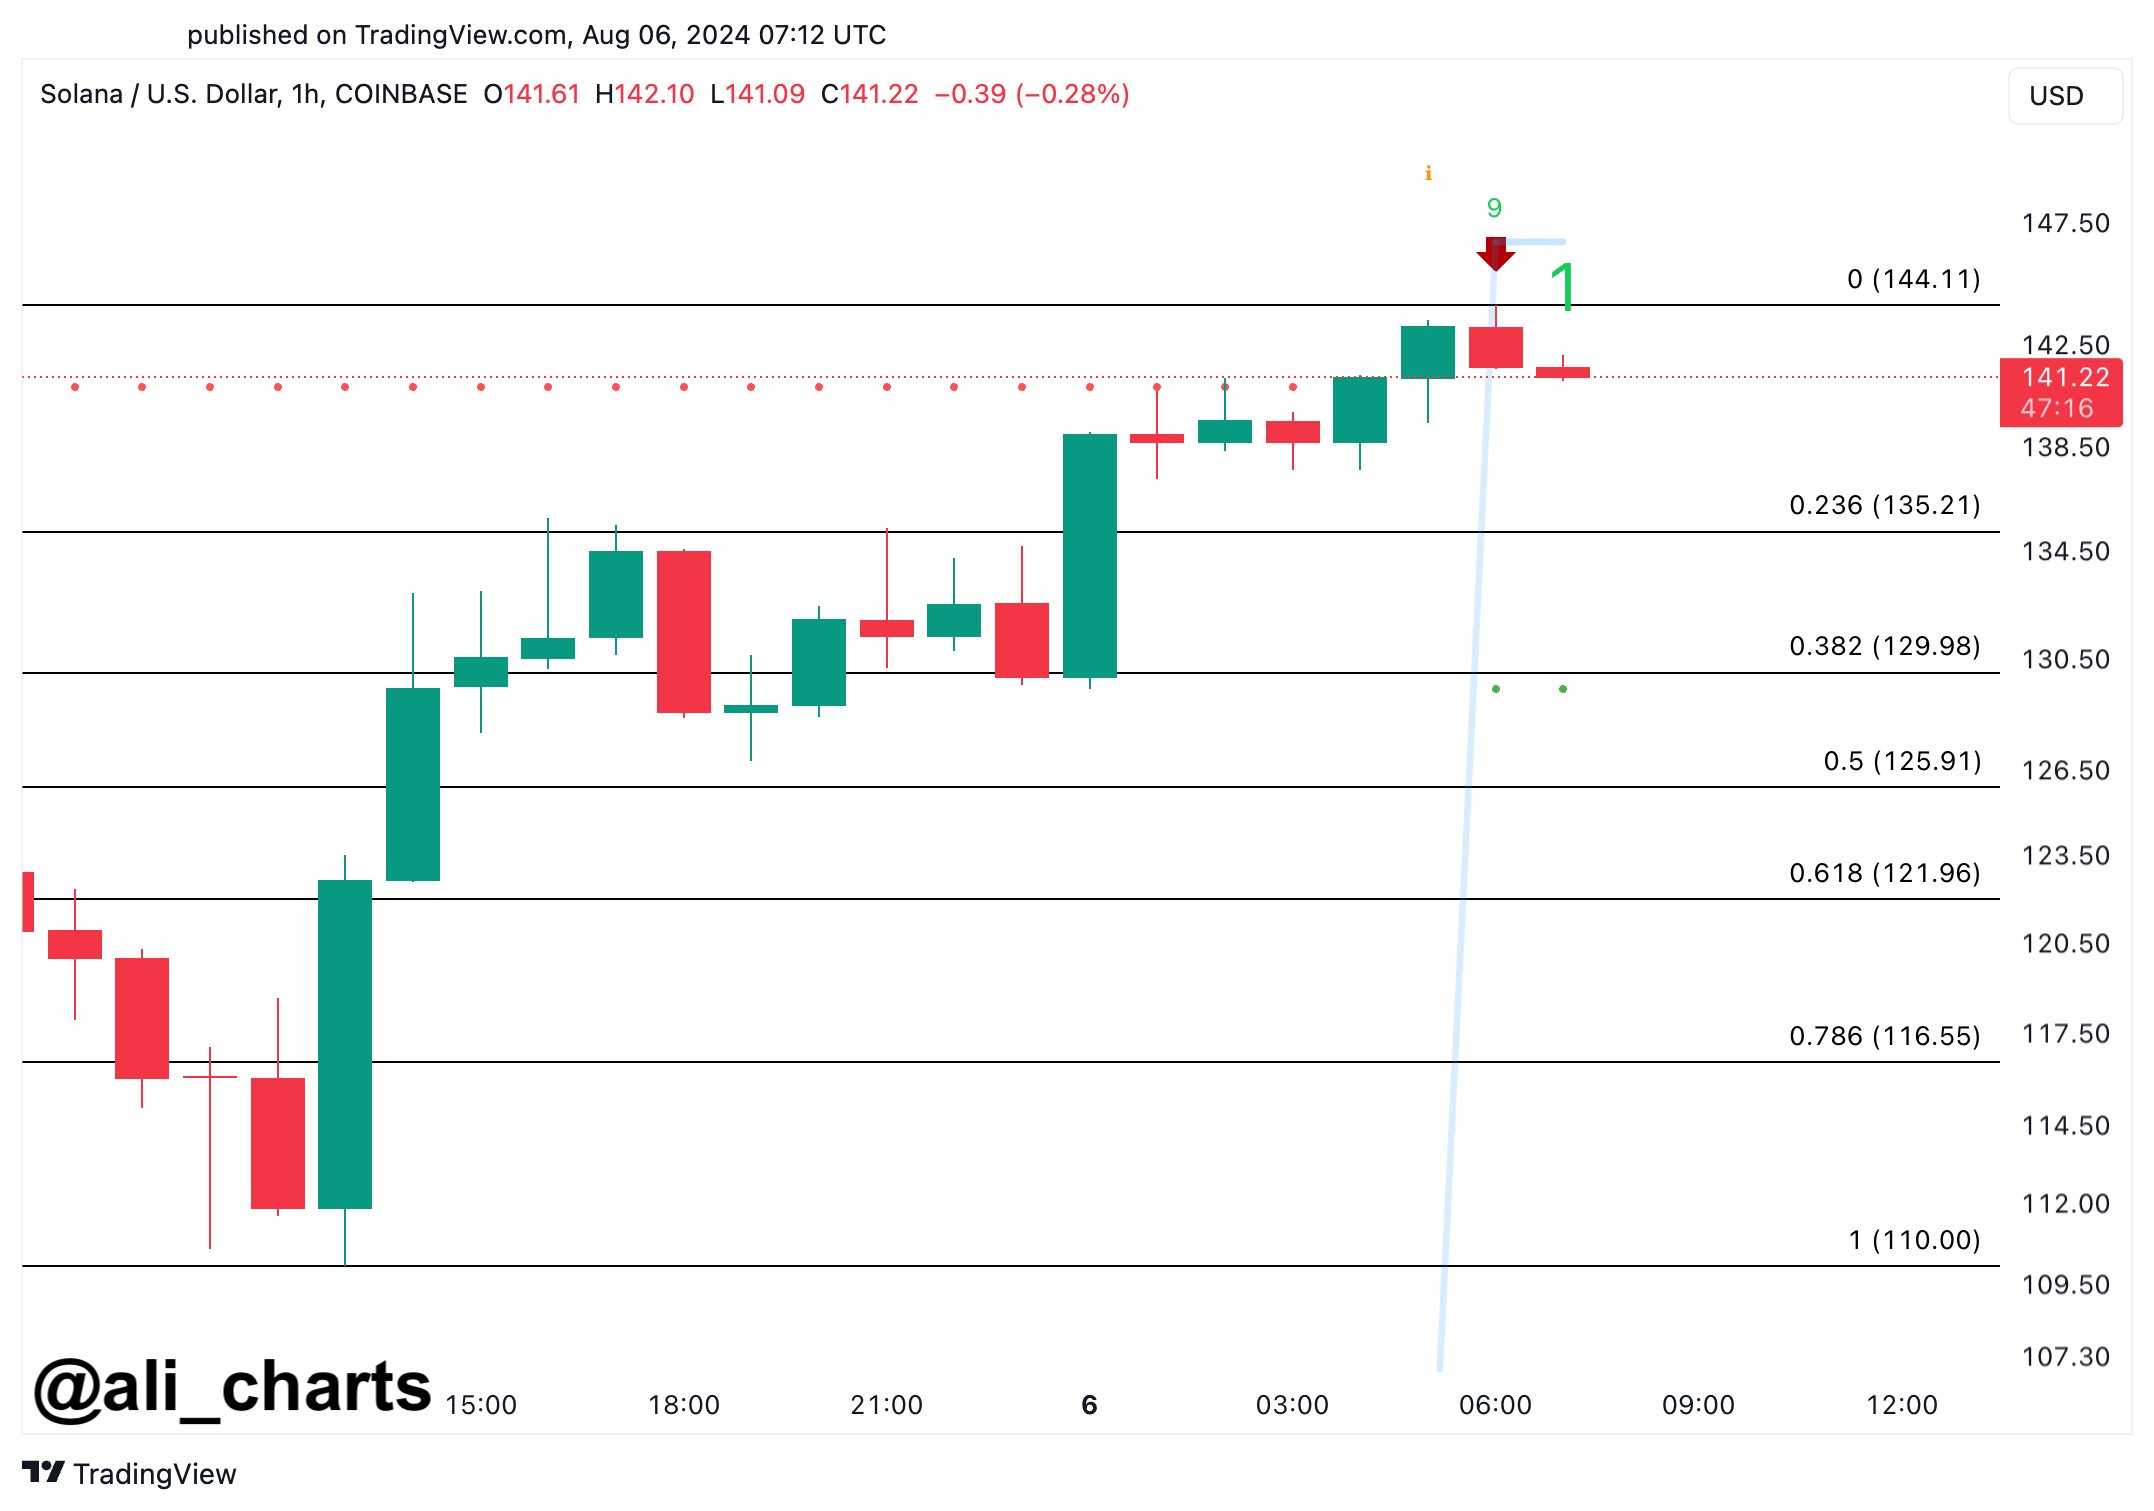
Source: X
However, SOL breaking above the risk line at $146 somewhat invalidated the sell signal, indicating a potential bullish scenario. This could drive the price towards the $155-$166 range.
If SOL fails to maintain its current levels and falls below $150, it may retest the support at $123.20. A breach below this support could signal a bearish trend, with potential for further declines. Monitoring these key levels will be crucial for traders to make informed decisions.
Especially since the overall trend remains cautiously optimistic, contingent on SOL’s ability to overcome the highlighted resistance levels and maintain its upward momentum.
Derivatives data analysis
Solana’s derivatives data revealed mixed signals though.
There was a 12.24% fall in volume to $14.47 billion, while Open Interest rose by 5.62% to $2.17 billion, according to Coinglass data.
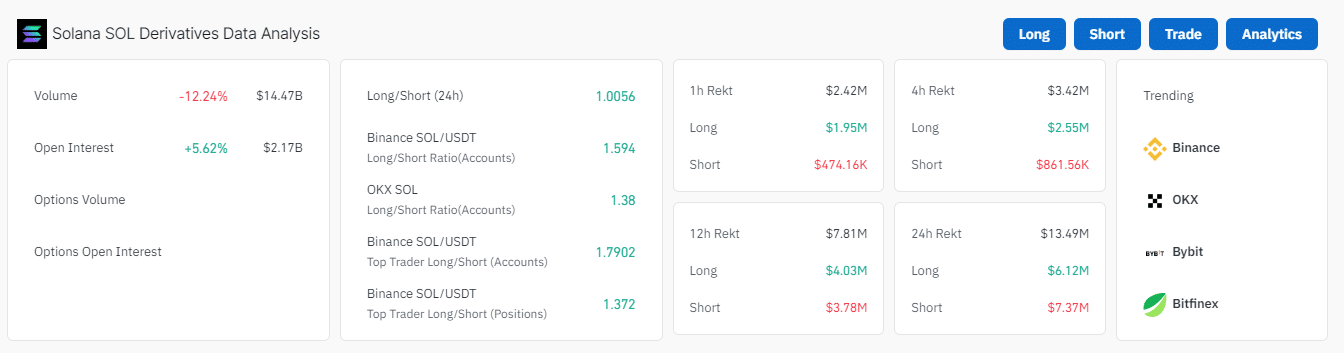
Source: Coinglass
Liquidations over a 24-hour period totalled $13.49 million, with $6.12 million in longs and $7.37 million in shorts. In the last 12 hours alone, $7.81 million were liquidated, with $4.03 million in longs and $3.78 million in shorts.
The 4-hour and 1-hour liquidations were $3.42 million and $2.42 million, respectively, indicating significant activity in both long and short positions.
Despite the recent surge, caution remains among market analysts. In fact, according to Ali, the downturn for Solana might not be completely over.
Hence, traders and investors are advised to keep a close watch on these developments to make informed trading decisions.

![Uniswap [UNI] price prediction - Traders, expect THIS after altcoin's 14% hike!](https://ambcrypto.com/wp-content/uploads/2024/12/UNI-1-400x240.webp)