- The Bitcoin rainbow chart showed intense bullishness for BTC over the next 12–18 months
- Market sentiment was lukewarm and public frenzy hasn’t gotten rolling, even though prices were just below ATH.
The Bitcoin [BTC] Rainbow Chart is a fun, uncomplicated way for investors to get an idea of where BTC is in its cycle.
Developed in 2014, it takes the past performance of the king of crypto and projects it forward using a logarithmic chart.
This smooths out some of the intense volatility Bitcoin has seen in the past decade, and the distinct color bands give investors an idea of market sentiment at a glance.
However, this is only for multi-year holders and not for day traders.
What does the Bitcoin rainbow chart project for 2024, and when should holders seek to take profits?
Bitcoin is still cheap!
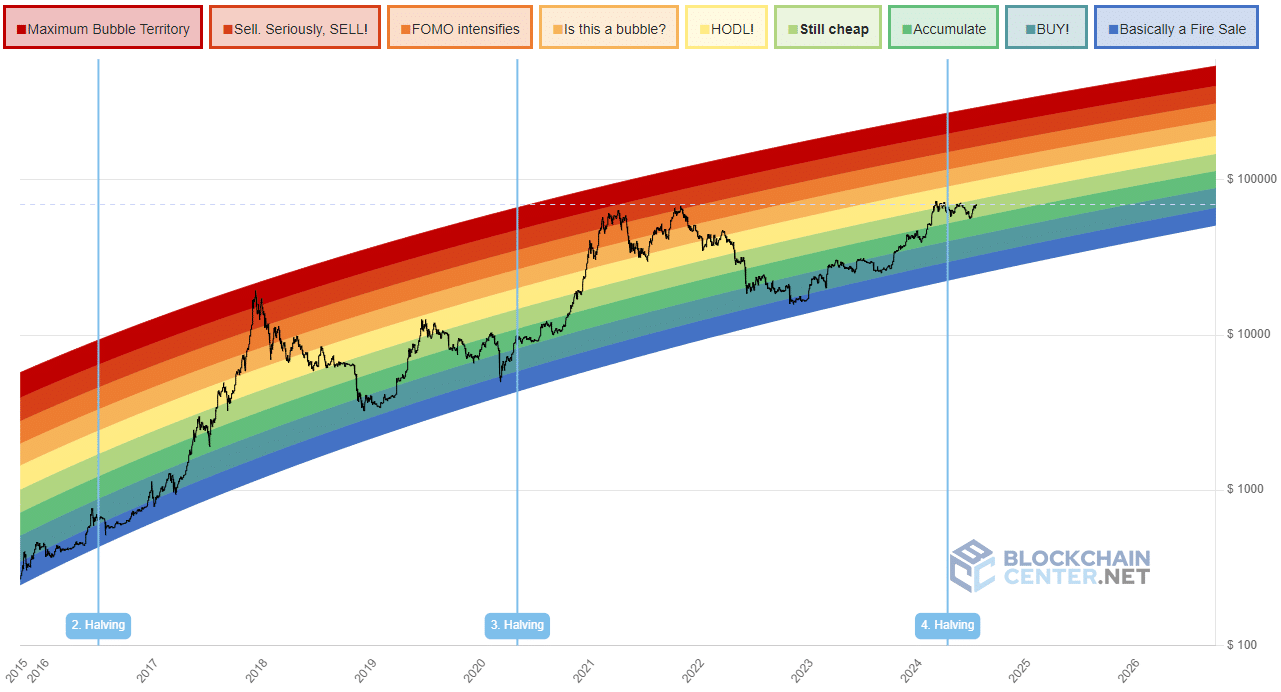
Source: Blockchain Center
Looking back at the past two halvings, we can see that prices take a few months to get the bull run going after the halving event. This cycle was different from the others so far.
The price rapidly increased before the halving, and set a new all-time high just a month after it.
Despite these gains, the price was still within the accumulation zone. This was immensely encouraging for holders and long-term investors.
As this prominent crypto trader points out, FUD events like Mt. Gox, the German government, or the U.S. government’s seized BTC selling were all behind us.
Public sentiment is lukewarm and prices are sitting a stone’s throw away from ATH. Things can heat up quickly and get more bullish a year into the future.
In the past cycle, the cycle top came 546 days after the halving. If history repeats itself, Bitcoin could form this cycle’s top in October 2025.
This could put prices in the $144k-$184k window, assuming the “sell, seriously, SELL” zone isn’t reached.
Insights from on-chain metrics
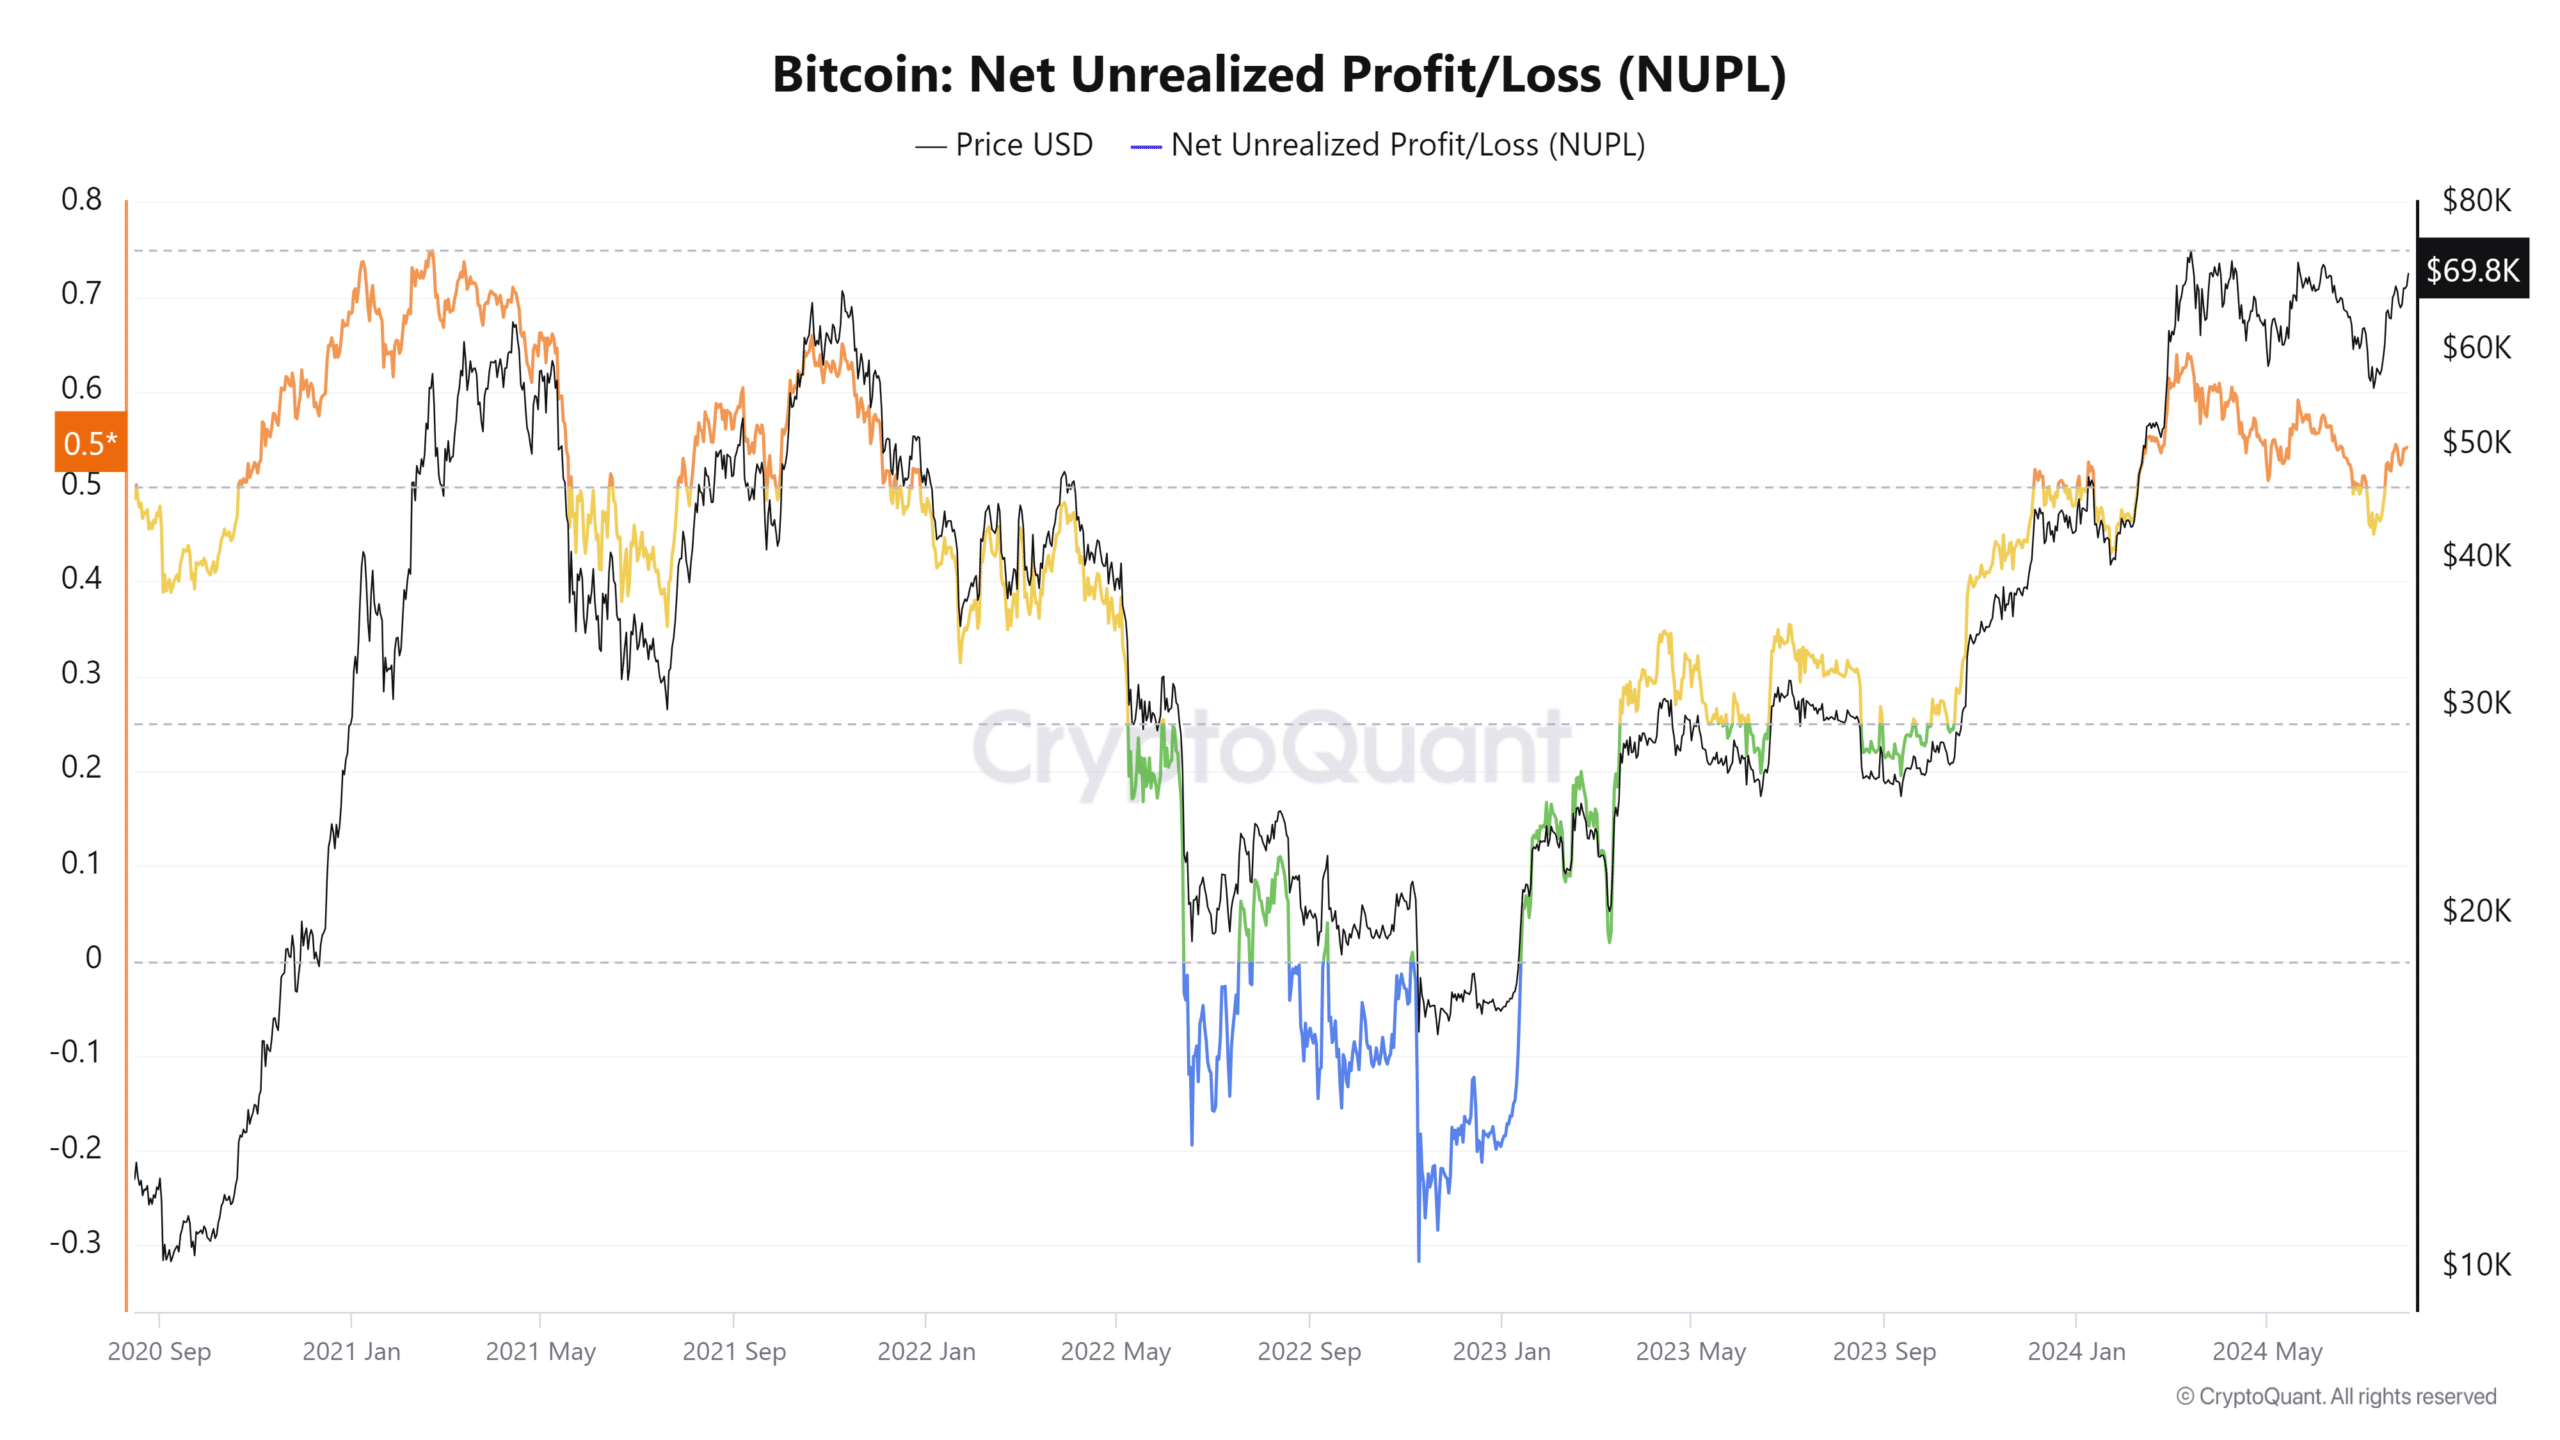
Source: CryptoQuant
AMBCrypto looked at the Net Unrealized Profit/Loss metric. This metric indicates the total amount of profit/loss in all the coins, represented as a ratio. Values above 0.7 generally indicate a market top.
In March 2024, the NUPL metric reached 0.62, representing overheated conditions and increased selling pressure from profit-taking. However, it has steadily trended downward since then.
This showed a decrease in selling.
Is your portfolio green? Check out the BTC Profit Calculator
Hence, there is more room for prices to expand upward. Additionally, the NUPL can remain in the area above 0.5 for months at a time. The latter half of 2020 is a prominent example, and the same could repeat in 2024.
Overall, long-term investors can choose to accumulate more BTC or simply HODL their bags. Continued price gains are likely to arrive, but it could take a few more months.