
Can JASMY sustain its 27% weekly rally? – THESE indicators say…

- Bitcoin’s price increased by 4% in the last seven days.
- Market indicators hinted at a price correction.
The entire crypto market has been experiencing a bull rally over the last week, as top coins registered double-digit gains.
However, the crypto fear and greed index was sitting at a “greed” position at press time, suggesting that there might be a trend reversal soon.
What the crypto fear and greed index suggests
The price of the king coin, Bitcoin [BTC], remained bullish over the last week as it traded above the psychological resistance of $65k. As per CoinMarketCap, BTC’s price increased by more than 4% in seven days.
At the time of writing, BTC was trading at $66,744 with a market capitalization of over $1.29 trillion. Apart from Bitcoin, Ethereum [ETH] bulls also dominated the market as its price increased by over 2% in the past seven days.
AMBCrypto then took a look at the fear and greed index to see whether the market was getting ready for a correction.
As per our analysis, at the time of writing, the crypto fear and greed index had a reading of 69, meaning that the market was in a “greed” phase.
Whenever the indicator hits that level, it indicates that the chances of a price correction are high.

Source: Alternative.me
Will BTC trigger the downtrend?
AMBCrypto then checked BTC’s rainbow chart to see whether it indicated a price correction, which might result in an entire market correction.
According to our analysis, BTC’s rainbow chart suggested that the coin was still cheap to buy. This clearly meant that investors still have the opportunity to accumulate more BTC before its price skyrockets.
As per the chart, BTC might touch $1.23 million before the market gets into a FOMO stage.

Source: Blockchaincenter
AMBCrypto then took a look at CryptoQuant’s data to find out what metrics suggested. We found that BTC’s exchange reserve was dropping, meaning that selling pressure on the coin was low.
Things in the derivatives market also looked pretty optimistic as BTC’s Funding Rate increased. However, the Taker Buy Sell Ratio turned red. This meant that derivatives investors were selling BTC at press time.

Source: CryptoQuant
Read Bitcoin’s [BTC] Price Prediction 2024-25
The market indicators looked pretty bearish on the coin. For instance, the Relative Strength Index (RSI) registered a downtick. Its Money Flow Index (MFI) also followed a similar trend as it went southward.
This clearly indicated that the chances of a price correction were high. Nonetheless, the MACD remained in the bulls’ favor, hinting at a continued price rise.
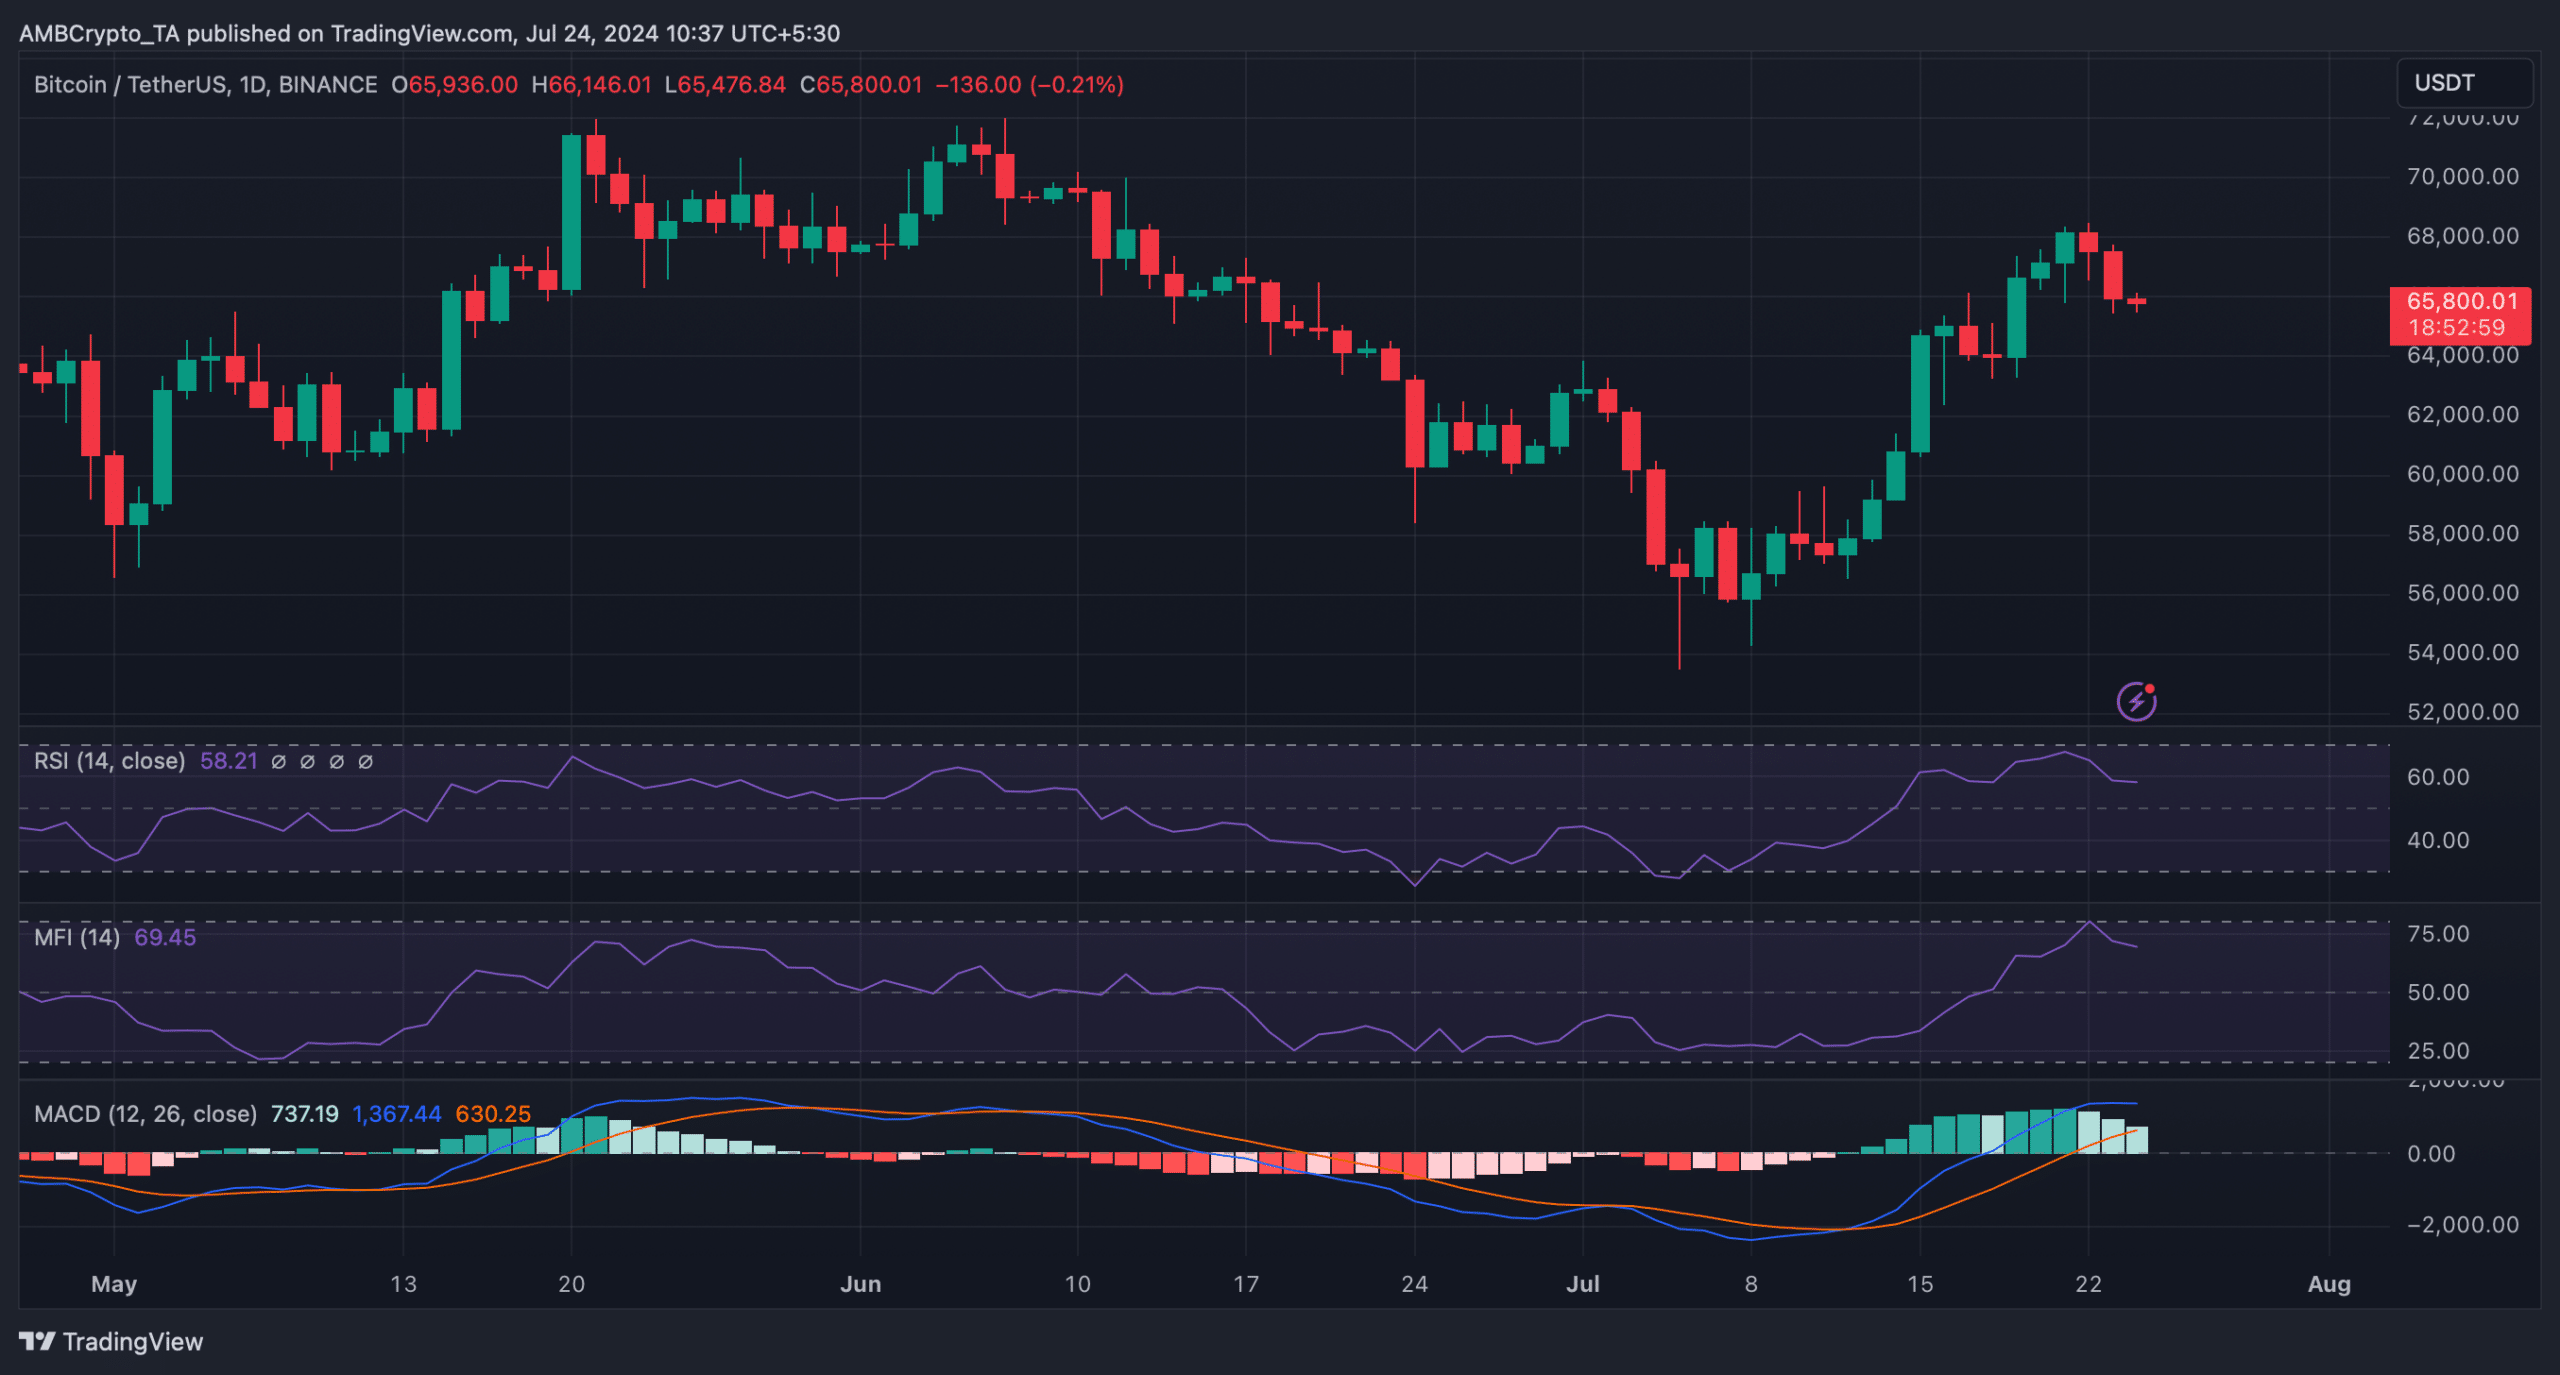
Source: TradingView


