


Disclaimer: The information presented does not constitute financial, investment, trading, or other types of advice and is solely the writer’s opinion
- The daily and 4-hour structures were bearish, giving ADA short sellers the green signal
- Fibonacci extension levels presented downside price targets
Cardano [ADA] may be poised to see further losses on the price charts. The move into a zone of demand last week was met with renewed pressure from the bears. The bears continued to be in control of the market and another 7.5% move south could materialize over the next two weeks.
Is your portfolio green? Check the Cardano Profit Calculator
At the time of writing, Bitcoin [BTC] was floundering around the $21.6k support zone. BTC’s retest of this area as support should have brought a firmer bullish reaction, one than what was witnessed over the past few hours. This could be an early signal that a wave of selling could sweep across the crypto-market once more.
The slow but persistent selling pressure is likely to force ADA lower
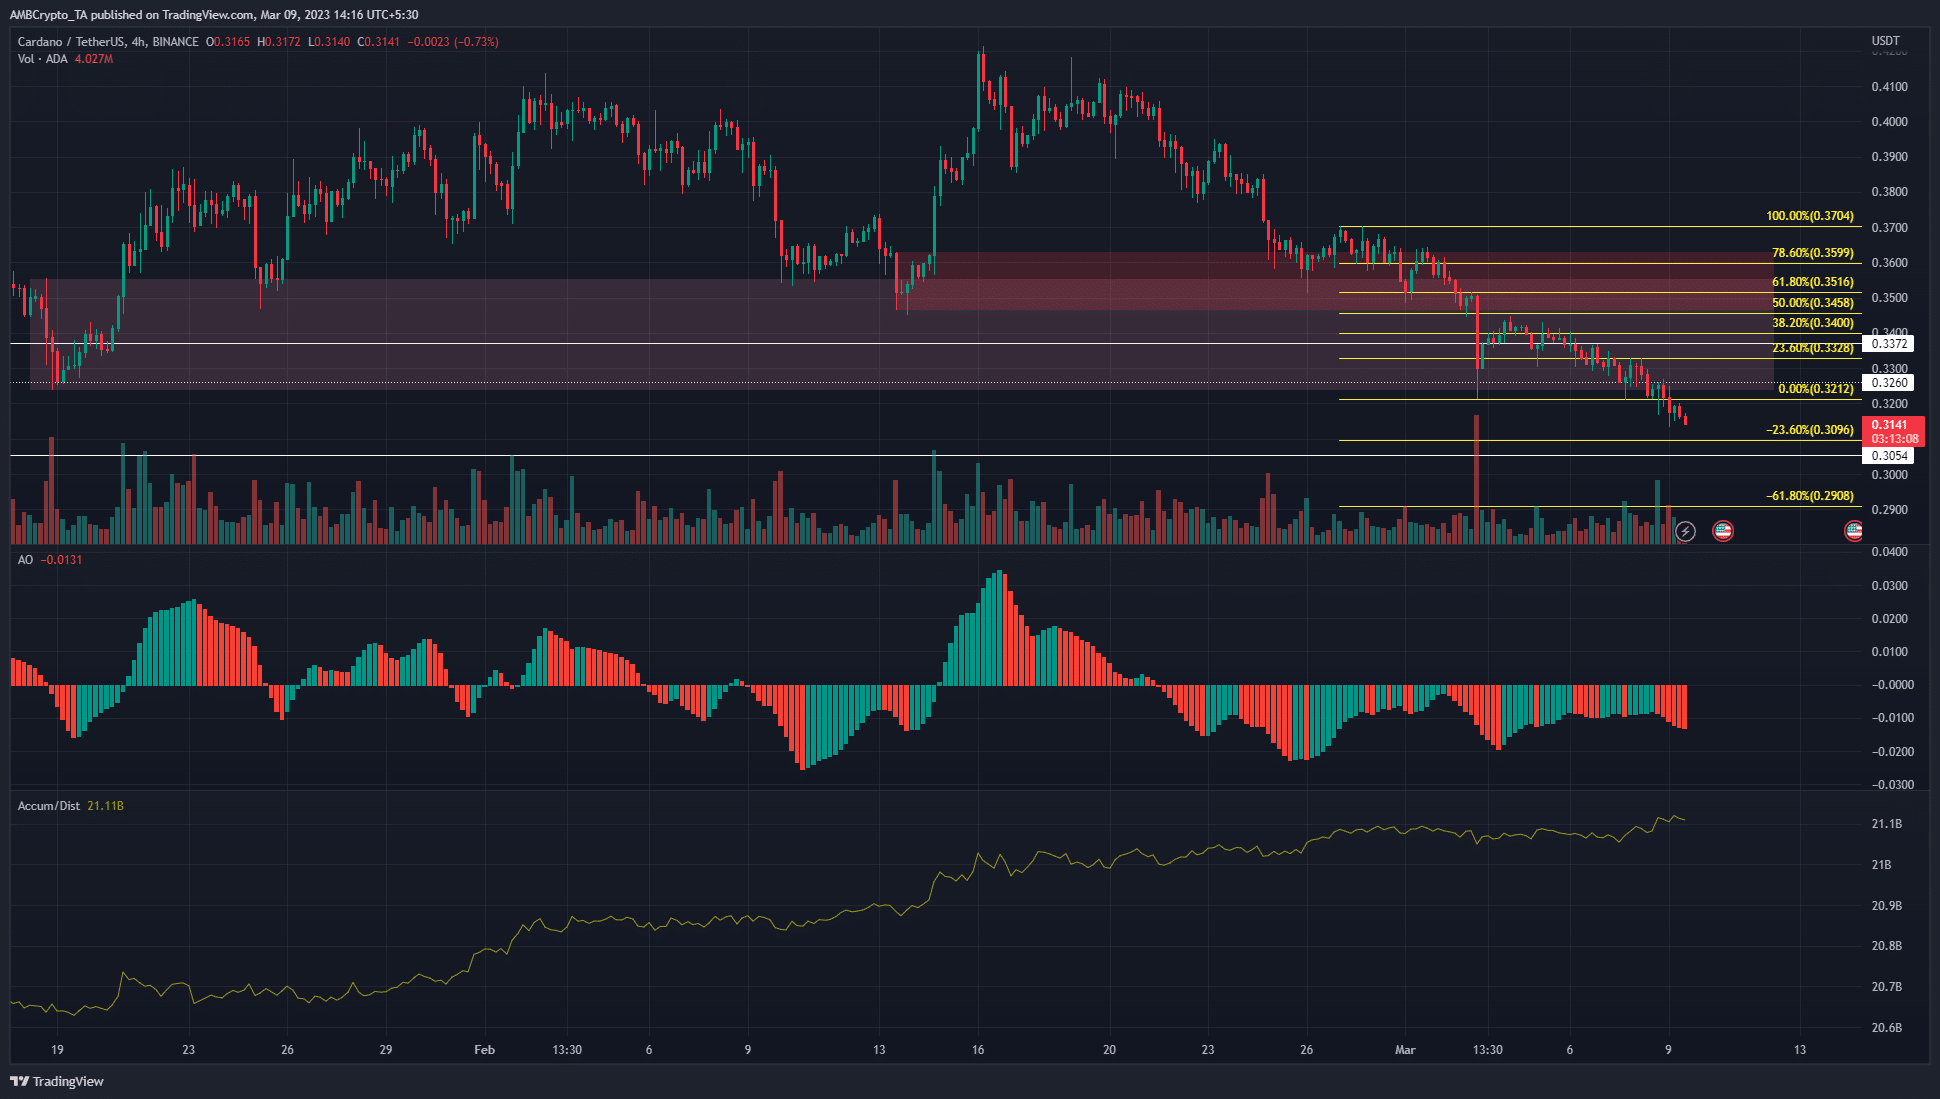
On the 4-hour chart, we can see that the structure was bearish. This happened after the price made a lower low on 22 February. However, it was expected that the two H4 and D1 bullish order blocks (highlighted by the dark and light red boxes) would provide a bullish reaction upon a retest.
Instead, the sentiment has slowly shifted in favor of the sellers. The recent announcements from the Federal Reserve’s Chair fueled a ripple of fear among investors across the market. And, this ripple could grow into a torrent over March.
The wave of selling over the last two weeks was not met with much resistance from the buyers. The next zone of support lay at $0.3-$0.305 and beneath that was the $0.273-level of support. The Fibonacci extension levels (yellow) showed $0.31 and $0.29 are levels where a bounce could occur.
How much are 1, 10, 100 ADA worth today?
To reverse the downtrend, ADA has to break out past the $0.34-$0.345 zone. The AO remained deep in bearish territory, but appeared to form a bullish divergence with the price over the last ten days.
Similarly, the A/D line was also advancing higher even though the price was in a freefall on the charts.
Spot CVD showed seller dominance and reflected the bearish sentiment
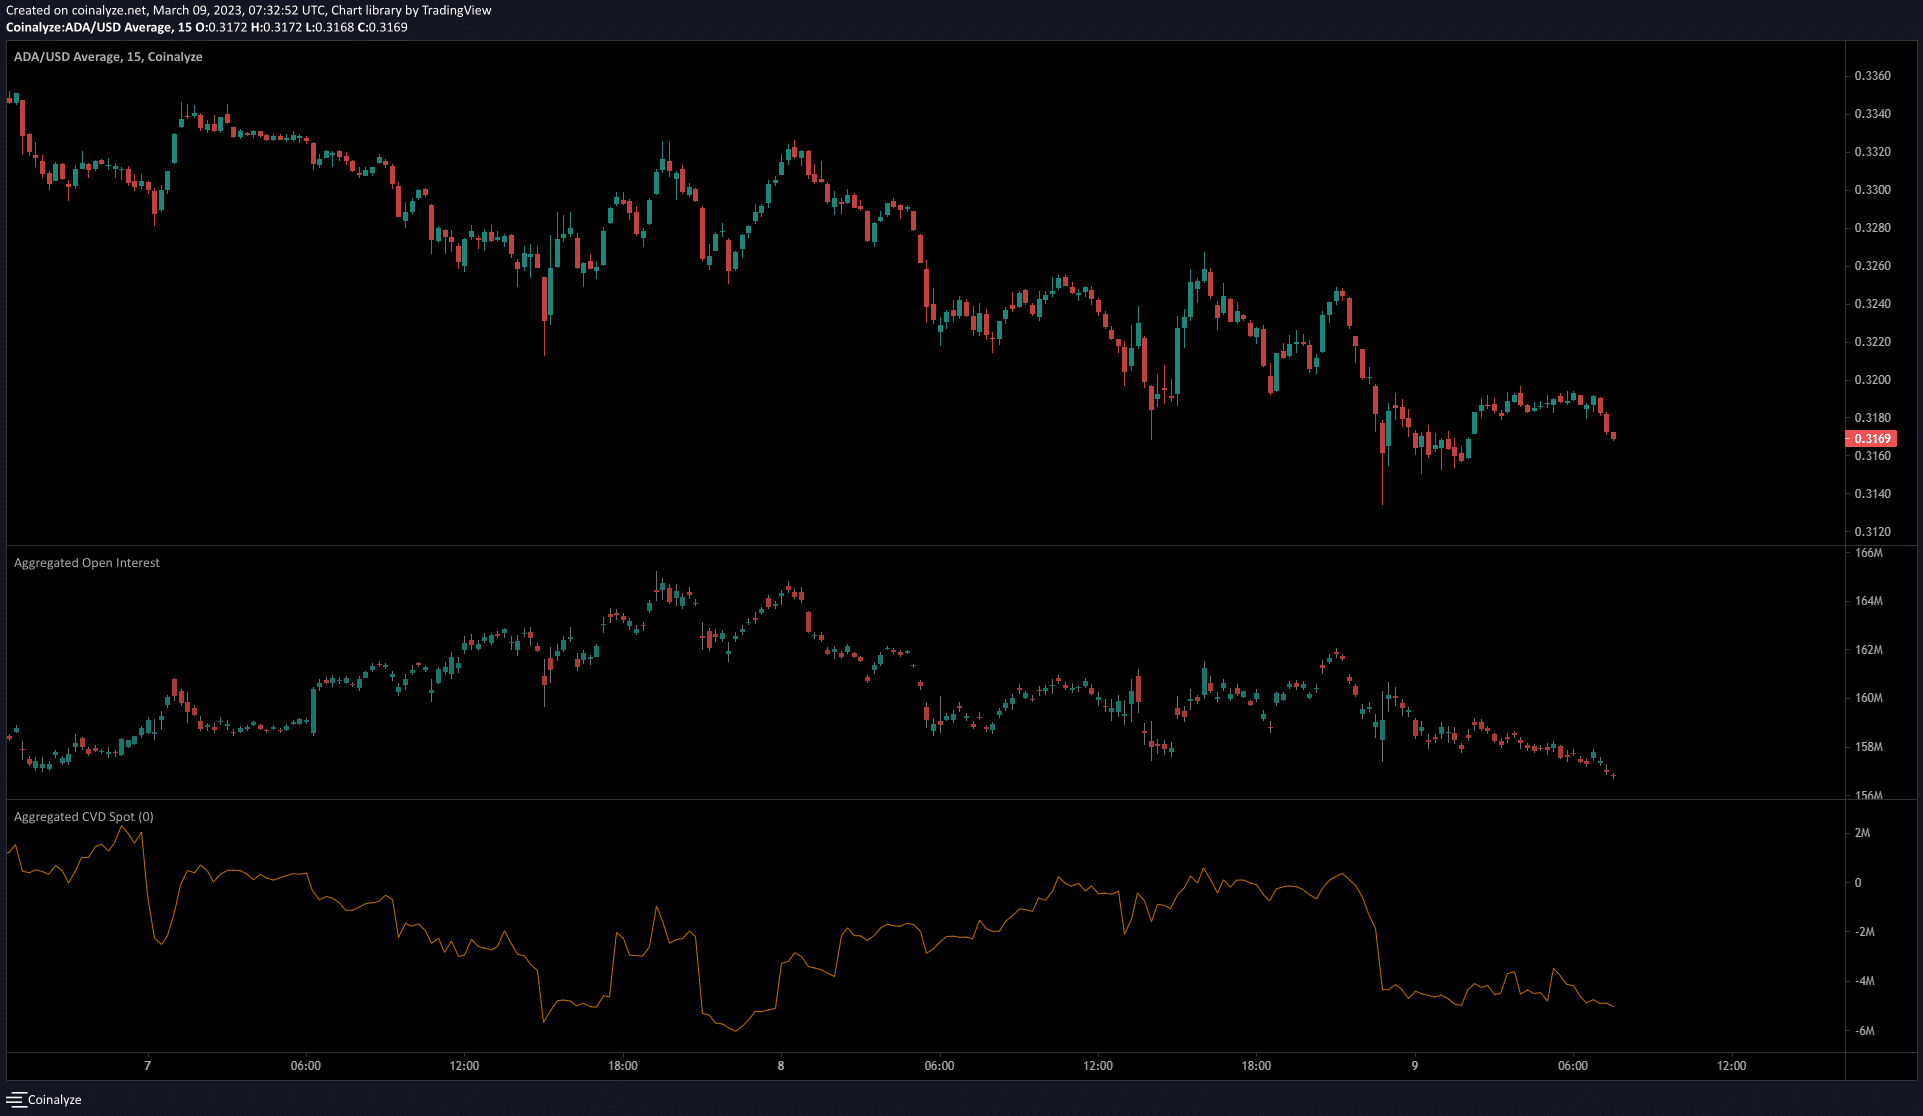
The spot CVD on the 15-minute timeframe showed a move north on 8 March, before a decline. During this period, Cardano bulls attempted to defend the $0.32-level, but were overwhelmed soon after.
Alongside the steady price decline, Open Interest has also fallen over the past couple of days. This is a sign that long positions have been discouraged and bearish sentiment is prevalent in the Futures market.