
- Jasmycoin has a strongly bullish outlook based on the on-chain metrics.
- The Fibonacci extension levels showed the token could rally another 60%.
Jasmycoin [JASMY] noted high volatility over the past two days. On the 3rd and 4th of June, prices rose by 25% within 36 hours. They retraced by 11.1% over the next two days and traded at $0.039 at press time.
Despite the lower timeframe volatility, the higher timeframes signaled bullish promise. How high can the move go, and does the on-chain metric support the idea of continued expansion?
The social metrics promised vast JASMY gains
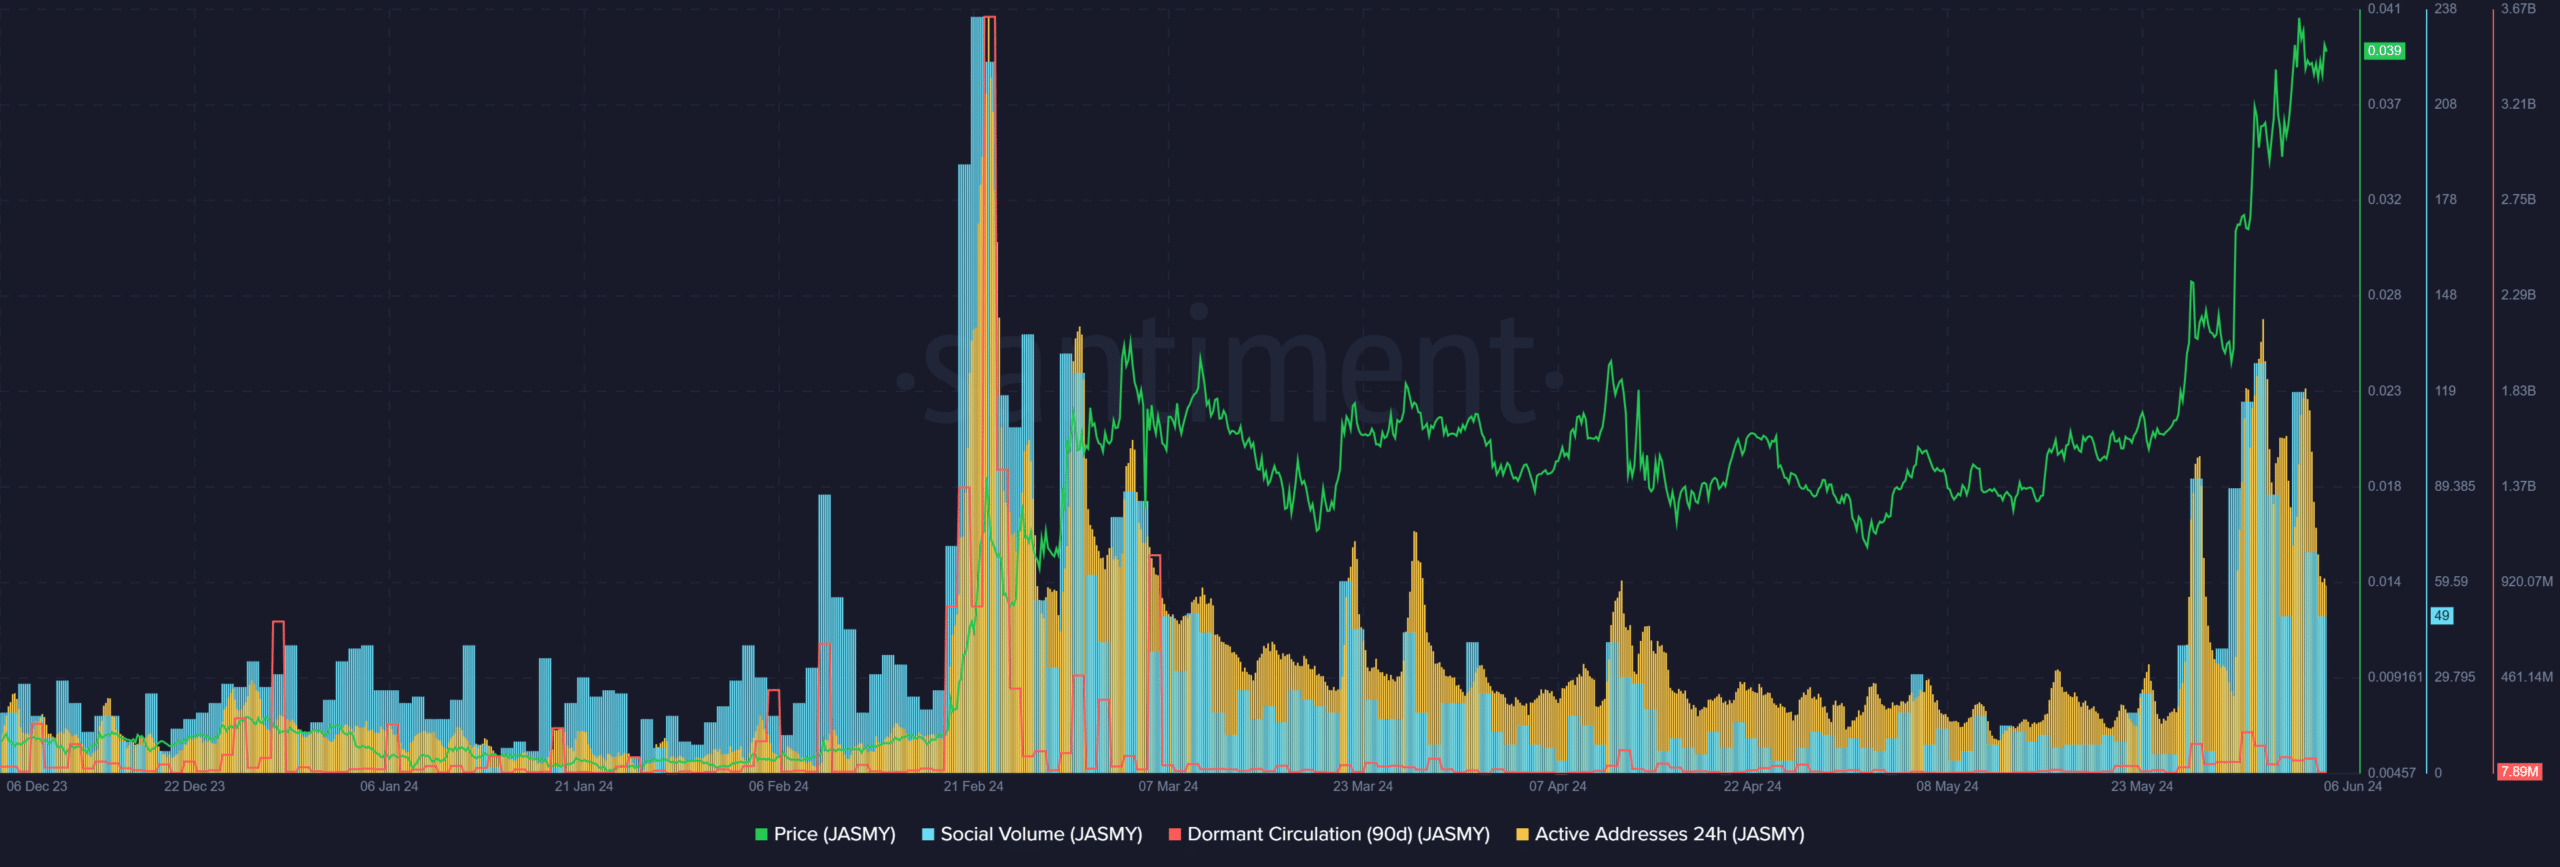
Source: Santiment
Like the February rally, the social volume, as well as the daily active addresses, were both surging. When it happened on the 20th of February, JASMY rallied 263% over the next two weeks.
While this does not guarantee another 260% rally, it showed that hype and momentum can drag an asset a long way forward.
The dormant circulation spikes were small in recent weeks, showing that a large wave of selling was not yet in sight.
During the February rally, despite a dormant circulation surging to indicate profit-taking, the prices continued to climb. Hence, even if the dormant holders wake up soon, investors have reason to hold on and not panic.
Robust bullish sentiment was detected based on these two metrics
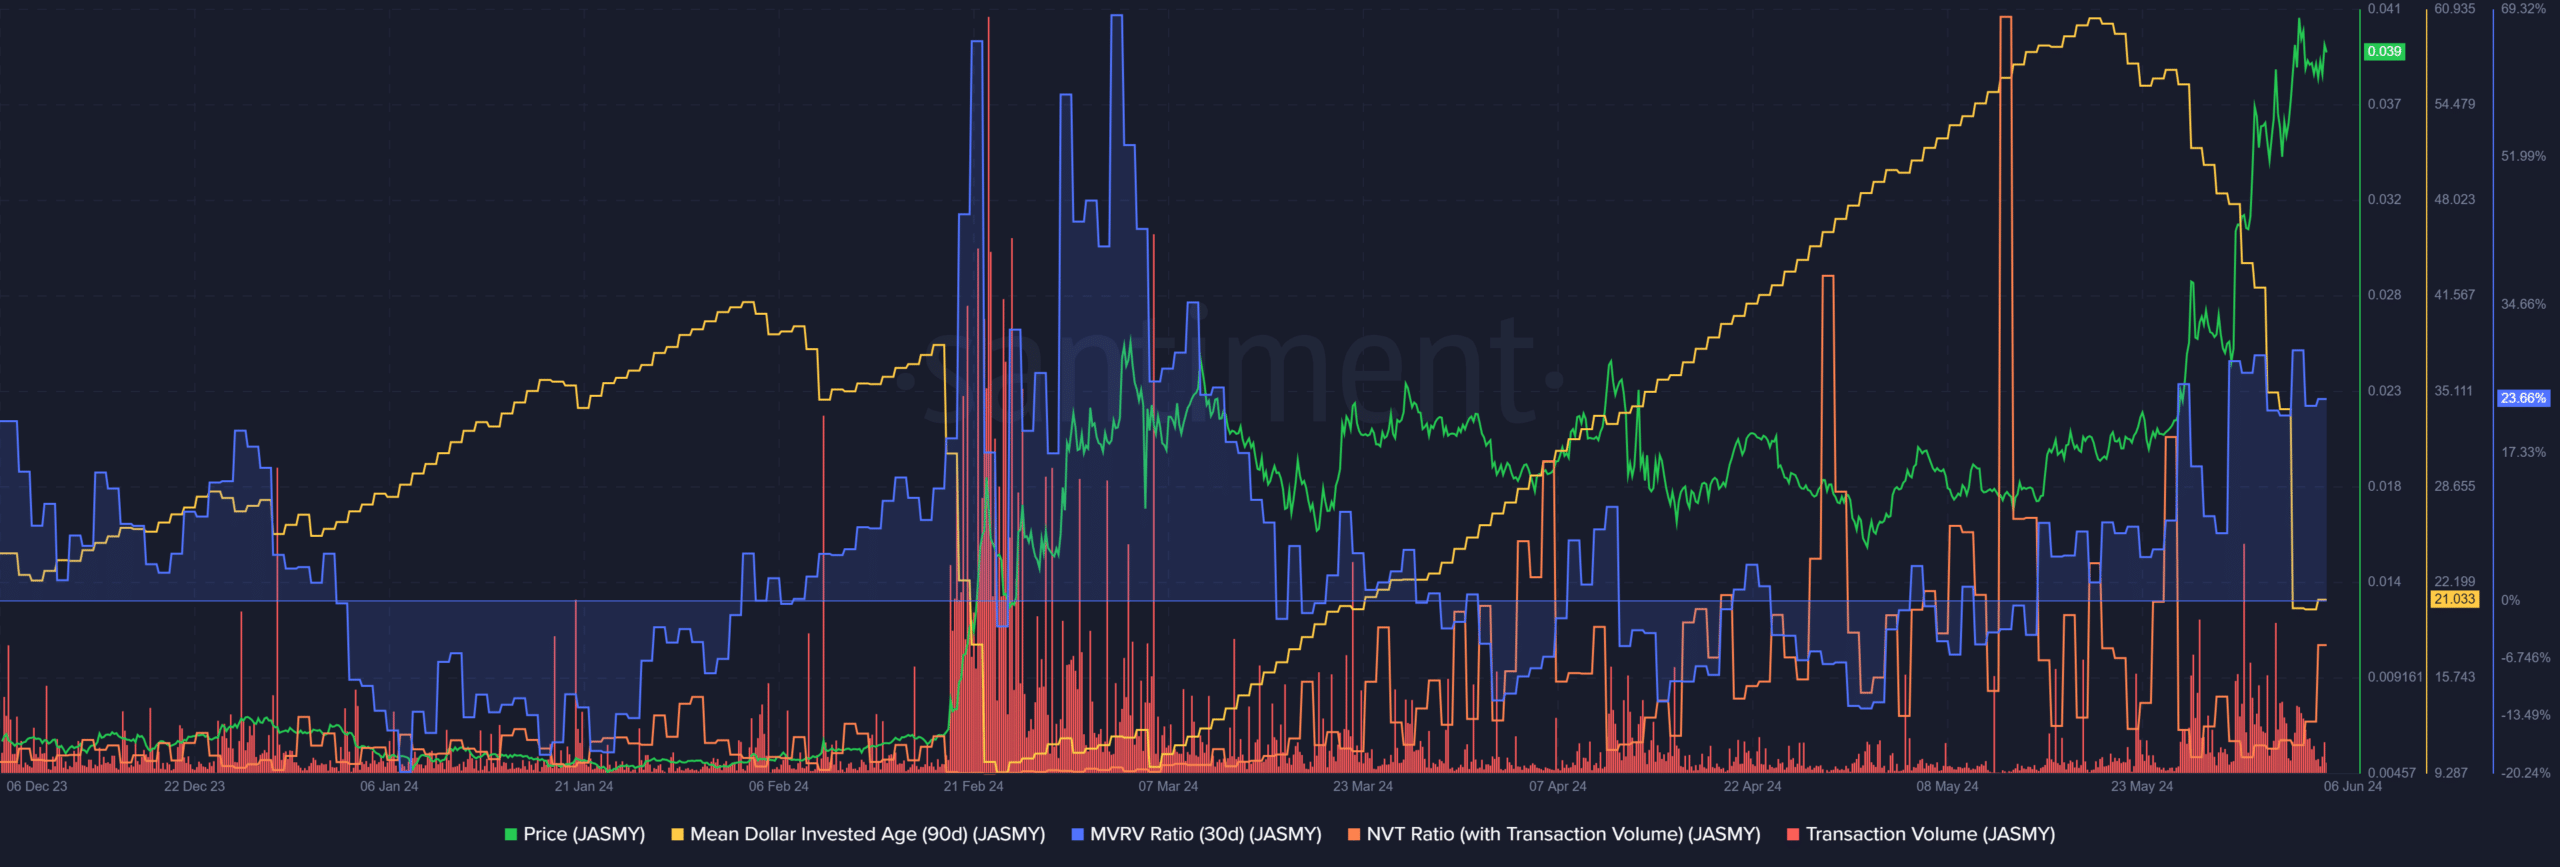
Source: Santiment
The 30-day MVRV shows whether short-term holders are in profit or not. The mean dollar invested age (MDIA) downtrend is a signal that the network is not stagnating. Together, they were strong evidence for a bullish JASMY.
The NVT ratio was not high, which indicated the coin was not overvalued based on its transaction volume. Overall, the metrics were positive.
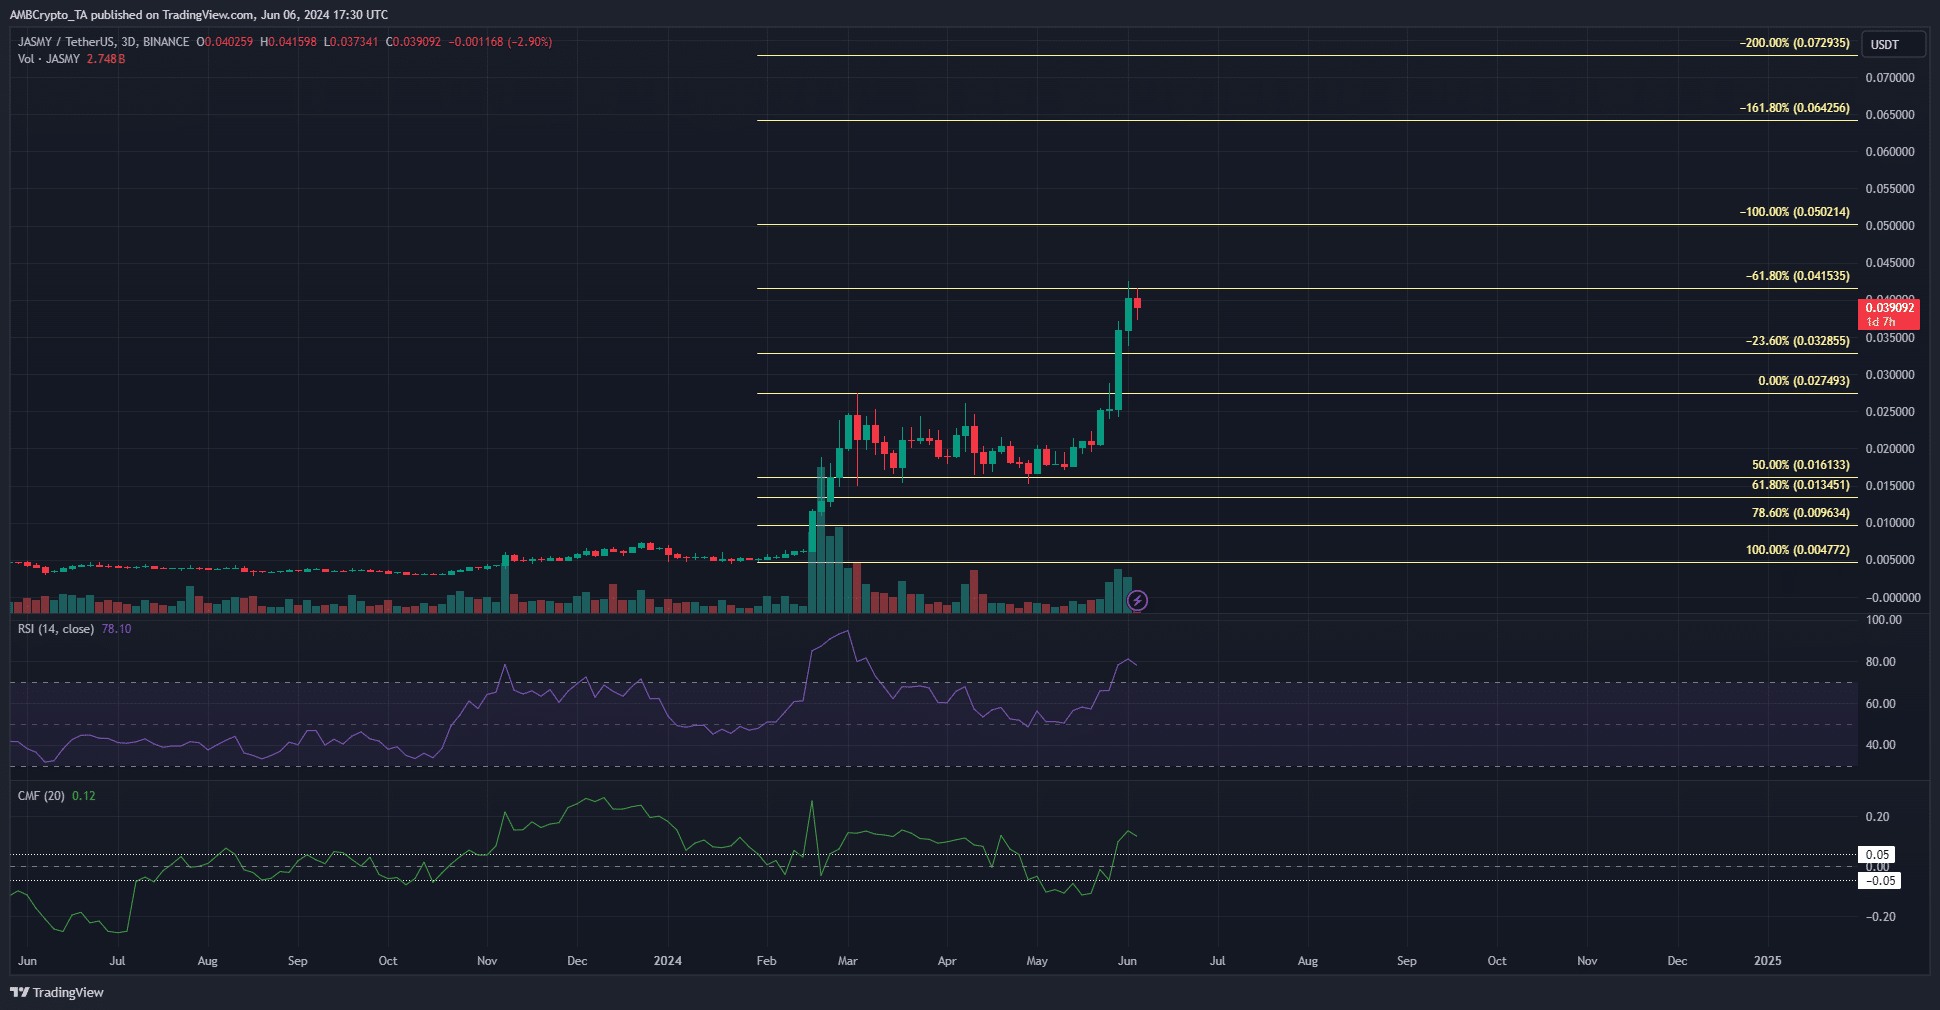
Source: JASMY/USDT on TradingView
The 50% Fibonacci retracement level served as support from March to May before the recent uptrend occurred. Using the same move, a set of extension levels were plotted. The $0.0415, $0.05, and $0.064 are the next bullish targets.
Read Jasmycoin’s [JASMY] Price Prediction 2024-25
The RSI on the 3-day chart showed intense bullish momentum and the CMF’s reading of +0.12 supported the idea of firm capital inflow.
Hence, it is likely we see another 30%-60% move higher. In case of a retracement, the $0.0256-$0.0288 region would offer a slightly aggressive long-term bullish re-entry.