JST retraces 20% after $0.1 rejection – Has JUST’s 3-month uptrend broken?
JST's uptrend survived Bitcoin's weakness. Can it survive its own structure break?

JUST [JST] has rallied strongly since February.
After flipping the $0.046 level to support, at a time when widespread panic ruled the crypto market, JST began to trend higher. It rallied from $0.046 to $0.097, a 112% move in three months.
In the past 24 hours, it saw a sizeable retracement in its uptrend. The token prices were down 10.7% in 24 hours, but the daily trading volume surged by 150%.
These price and volume trends suggested distribution instead of a mere retracement. Is it too early to conclude that the uptrend is ending?
JST’s 20.7% fall in a day has shaken bullish confidence
Over the past two weeks, Bitcoin [BTC] has been falling from the $82k resistance zone.
The leading crypto is operating within a longer-term bearish trend. Its quick losses have turned the altcoin market’s sentiment firmly bearish.
However, it had not been enough to halt JUST token’s uptrend that lasted till the end of May. It should be noted that a similar JST rejection from the $0.091-$0.10 area has also happened in September 2021 and April 2022
In April, the DeFi ecosystem on the TRON [TRX] blockchain announced the completion of the third JST buyback and burn of 271.3 million JST tokens. The burn events had helped sentiment and kept the uptrend going.
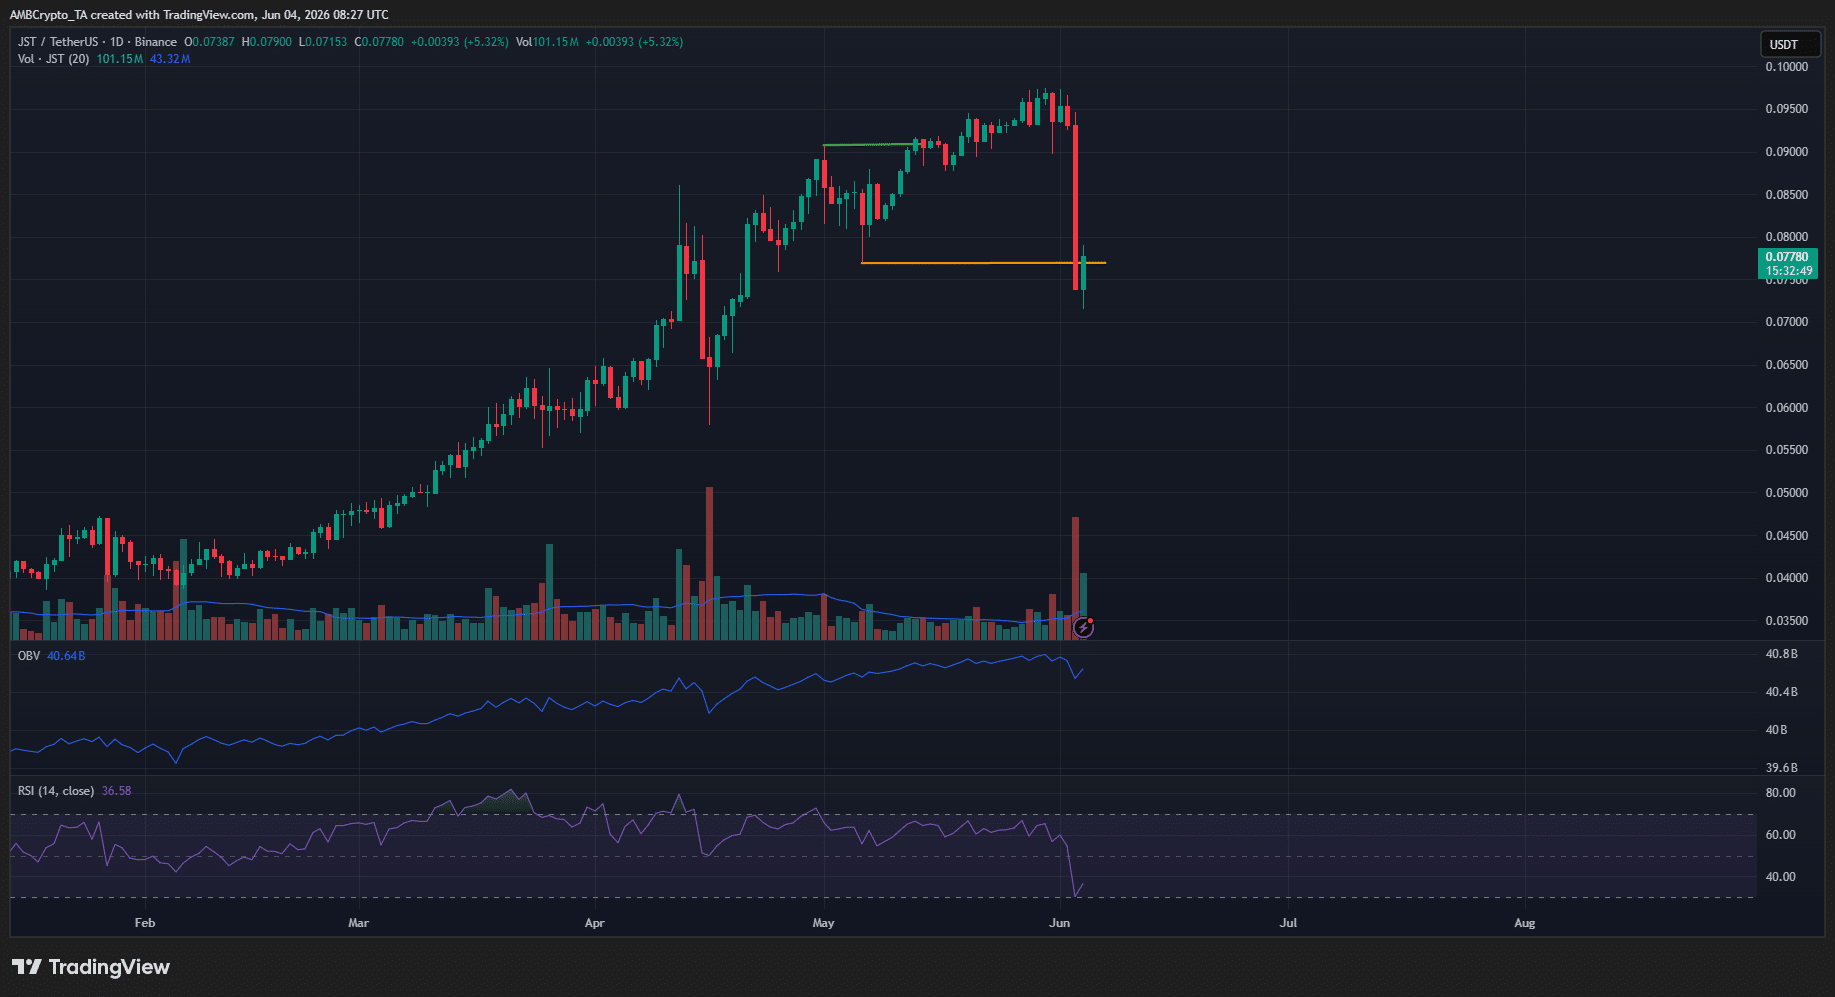
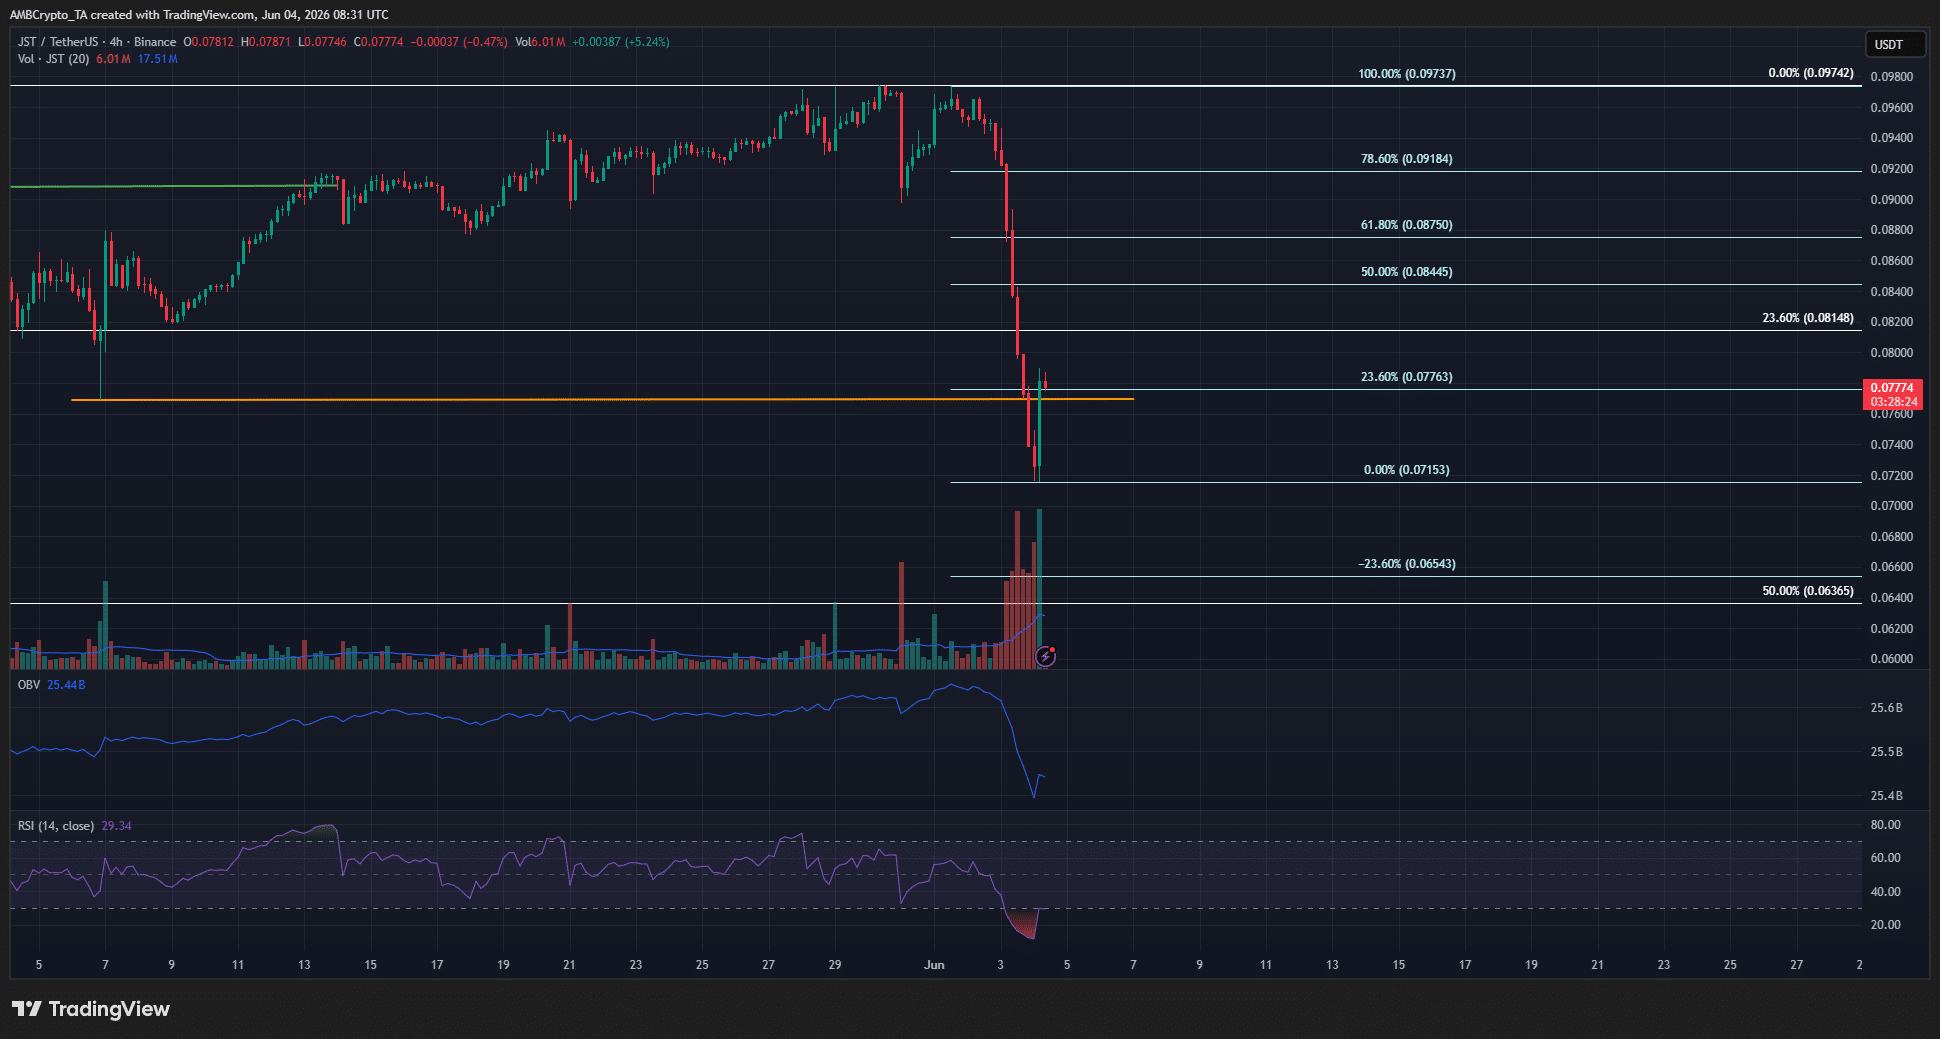
The 1-day timeframe showed the higher low at $0.0769 (orange) breached on the 3rd of June. The high volume wipeout appeared to end the uptrend, since the formerly bullish structure has been cleanly breached.
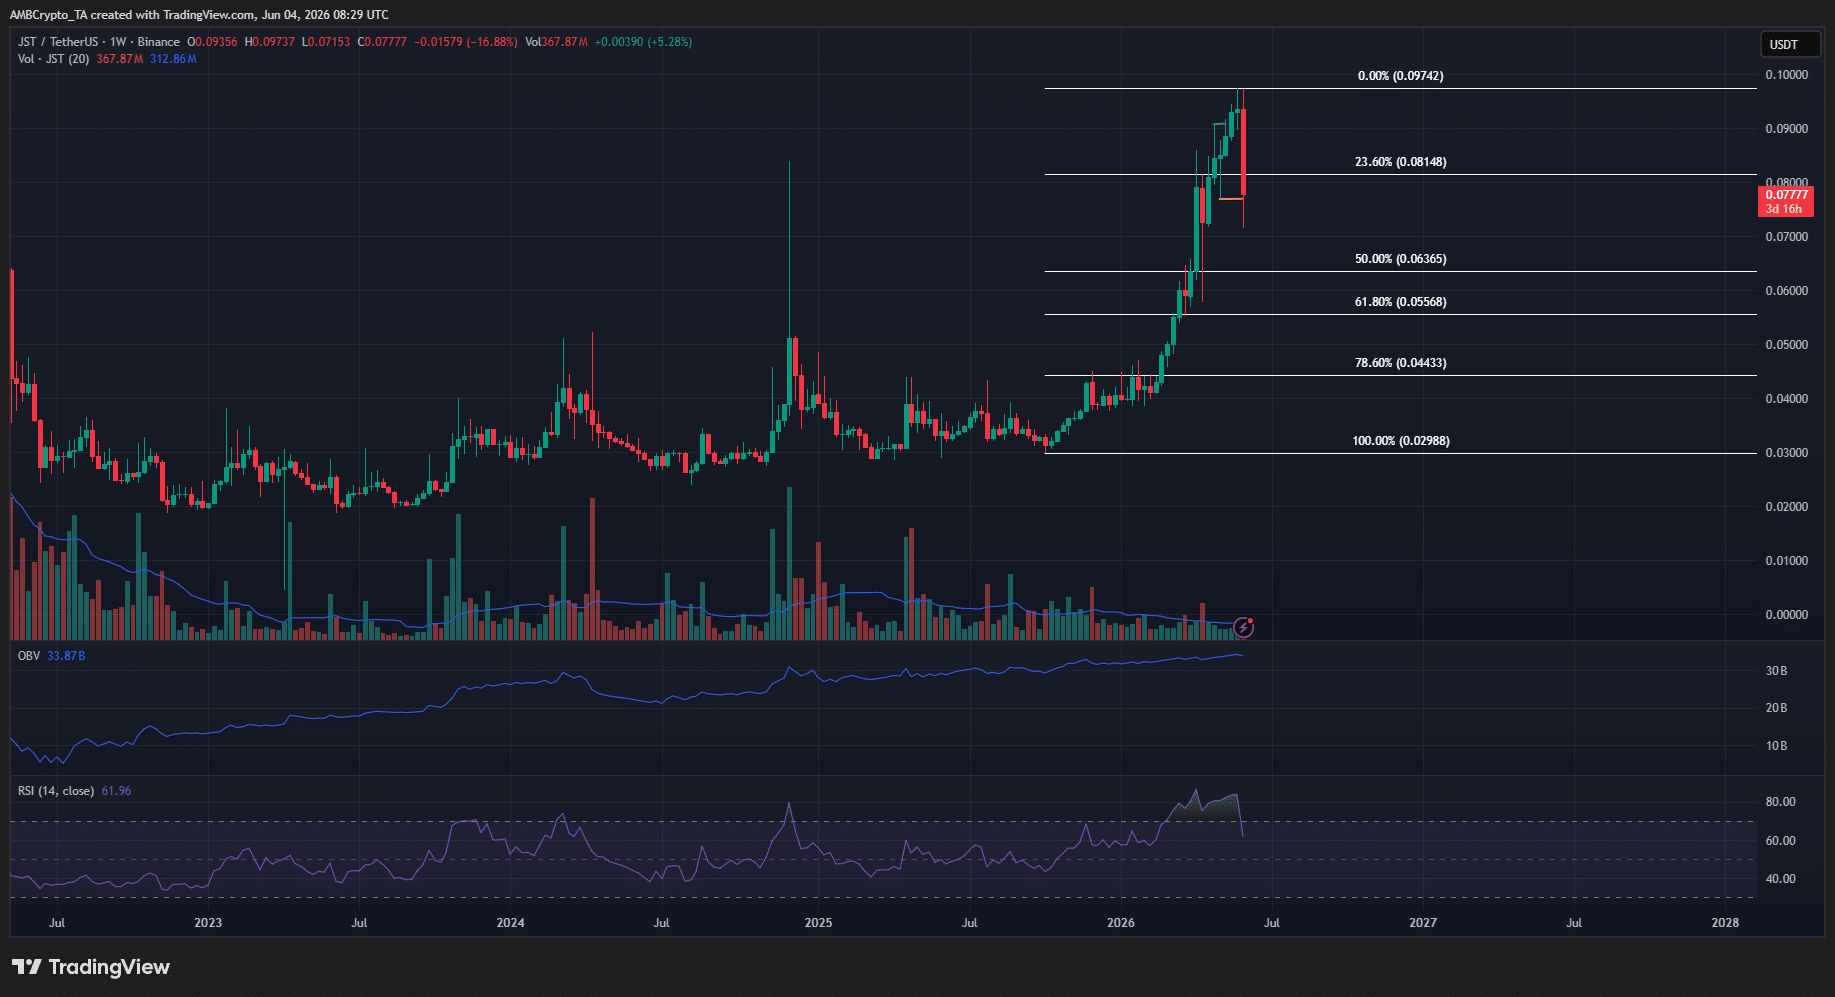
For context, despite the daily timeframe’s structure break, the higher timeframe trend remained bullish. As things stand, a retracement to $0.044-$0.055 appeared likely.
Traders’ call to action- Sell the bounce
JST could bounce to the $0.087-$0.091 golden pocket before continuing its higher timeframe retracement toward $0.044-$0.055. Therefore, traders can wait for such a bounce before selling.
It is possible that the bounce might struggle to clear even the $0.084 level. It depends on bearish conviction and when the next wave of selling commences. Traders need to be nimble, but can maintain a “sell the bounce” stance.
Final Summary
- JUST token buybacks and burns helped sustain the uptrend while most of the crypto altcoins failed to trend sustainably higher.
- The recent structural shift could see a bounce toward $0.091 before continuing its fall toward $0.05.