- Jupiter has traded within the upper half of the Bollinger Bands for nearly ten days now, reinforcing the bullish bias.
- The $1 area was flipped to support, but it might be tested again in the near-term.
Jupiter [JUP] is a decentralized exchange (DEX) aggregator for the Solana [SOL] blockchain. Measured from the 8th of July, this token has rallied 65%.
The market structure turned bullish after the $0.8 resistance was breached. A more conservative way of looking would indicate that the structure was still bearish due to the wild volatility on the 4th of July.
Even so, the bigger picture doesn’t change much.
The bearish order block is the immediate target
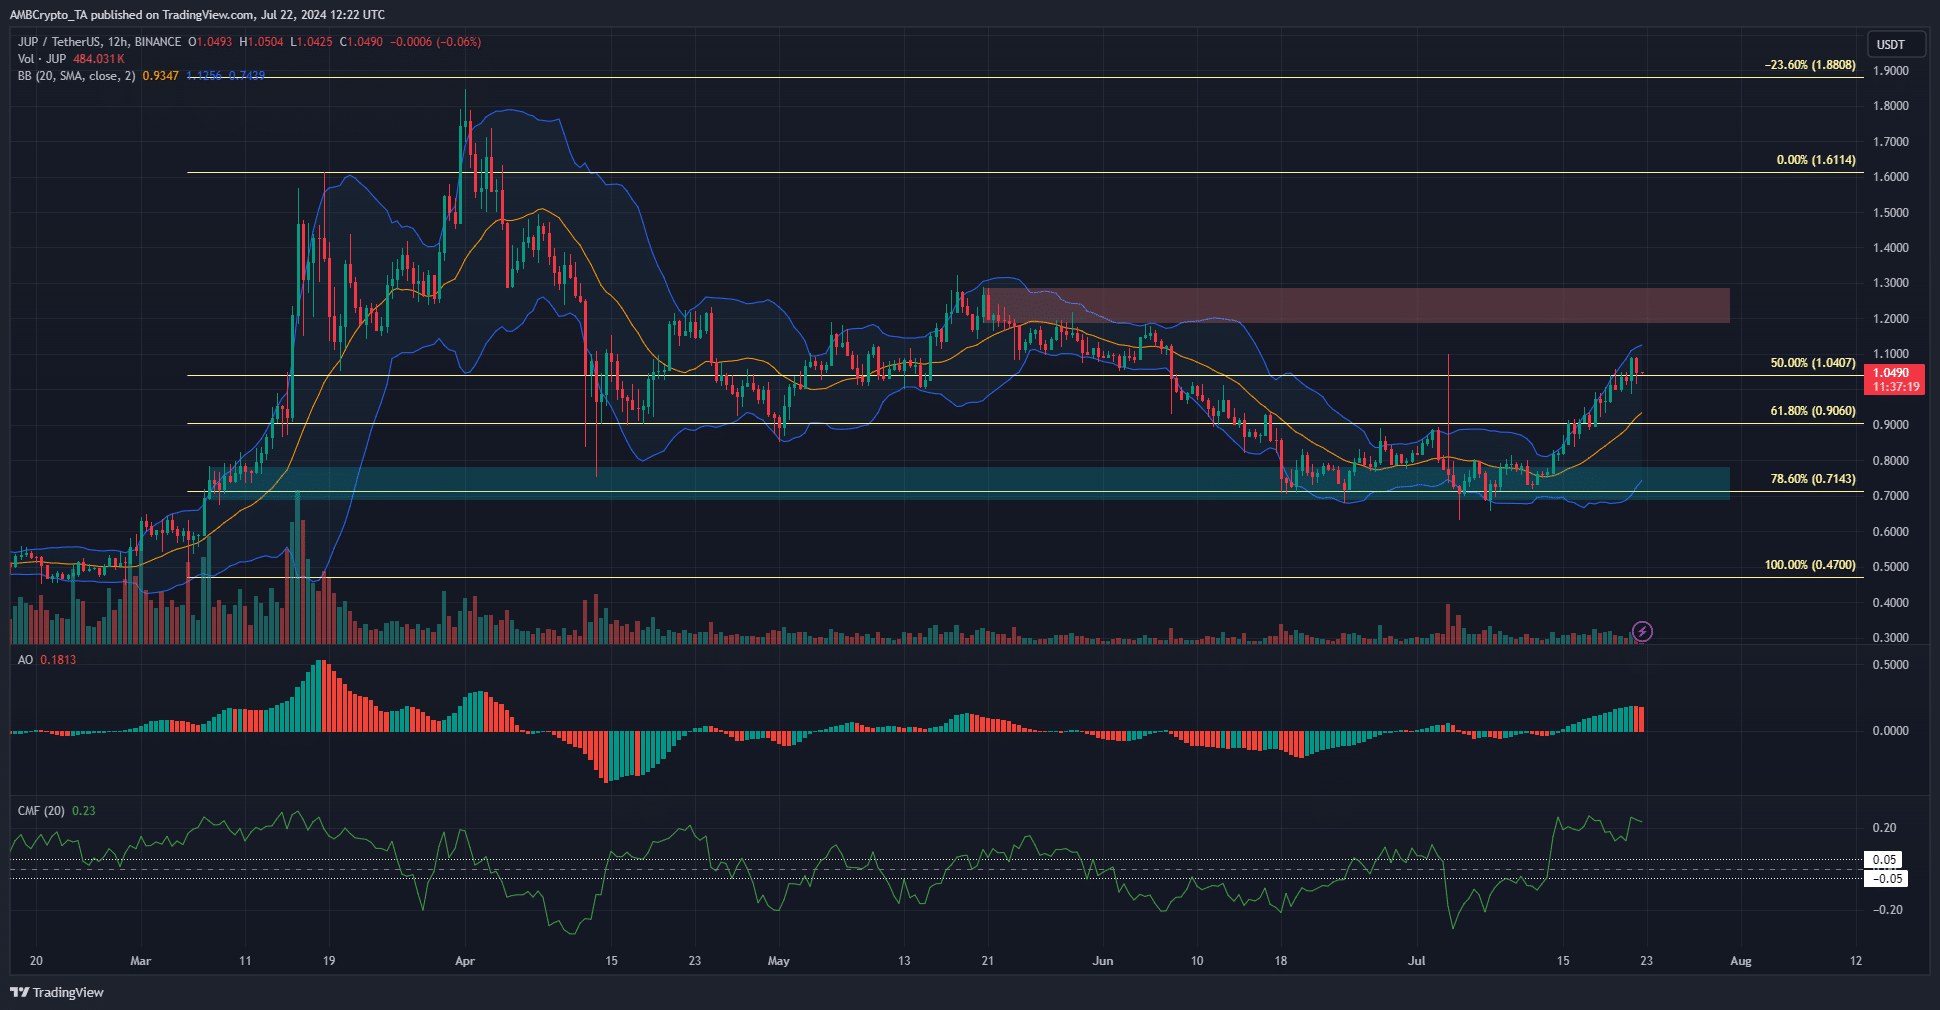
Source: JUP/USDT on TradingView
The H12 bearish order block (red box) at the $1.2-$1.3 zone is the next key resistance. This area has served as resistance since mid-April. The indicators were firmly bullish and signaled that the rally would extend past $1.
A worrying factor for buyers is the relatively low trading volume. It was easily eclipsed by the volumes the token saw in February and March, making it likely that the bullish sentiment isn’t as widespread as the price action made it appear.
Traders can see some lower timeframe volatility and price dips. This could see the 20-period SMA (orange) of the BB tested.
As things stand, the price has been in the upper half of the Bollinger bands for nine days. This was another sign of bullish momentum.
Liquidity analysis shows magnetic zones beyond $1 beckon Jupiter
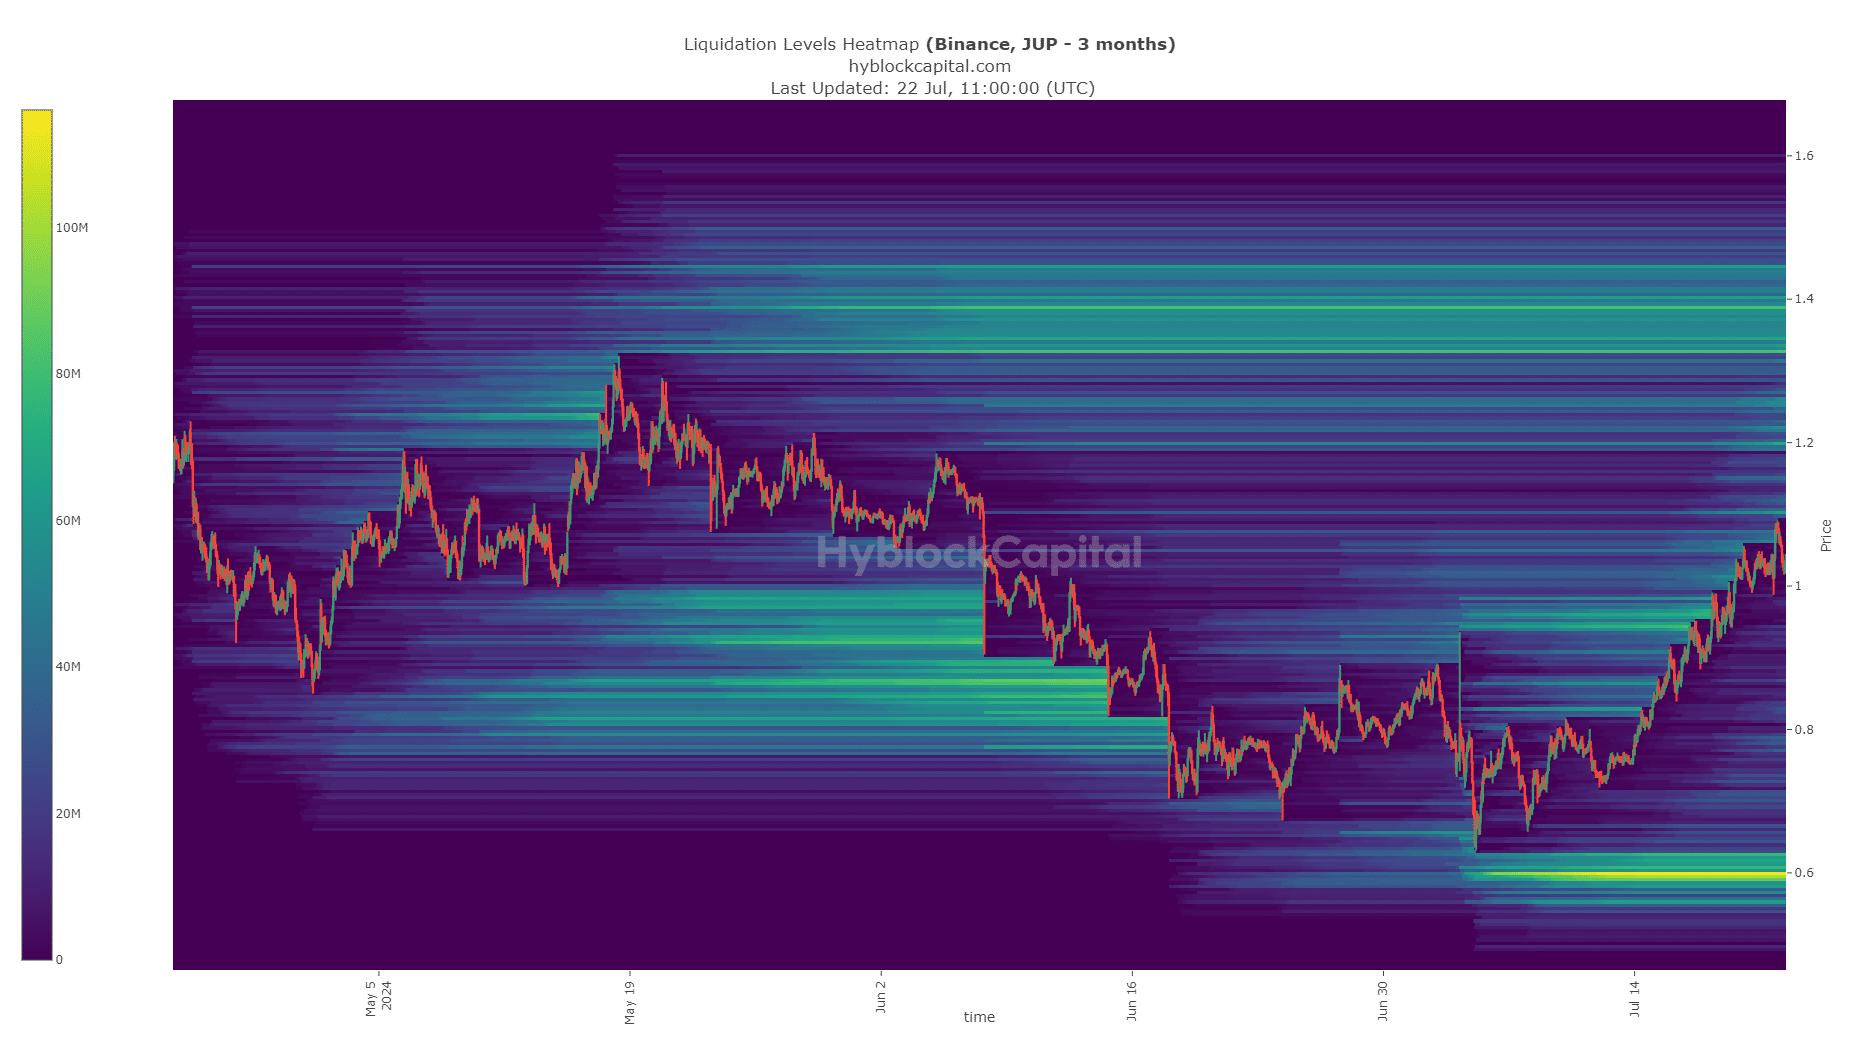
Source: Hyblock
The $1 level was breached, and the liquidity cluster at $0.95-$0.98 was taken out without a fuss. To the north, the $1.2 and $1.4 levels would be the next targets.
This lined up well with the bearish order block target from the price chart.
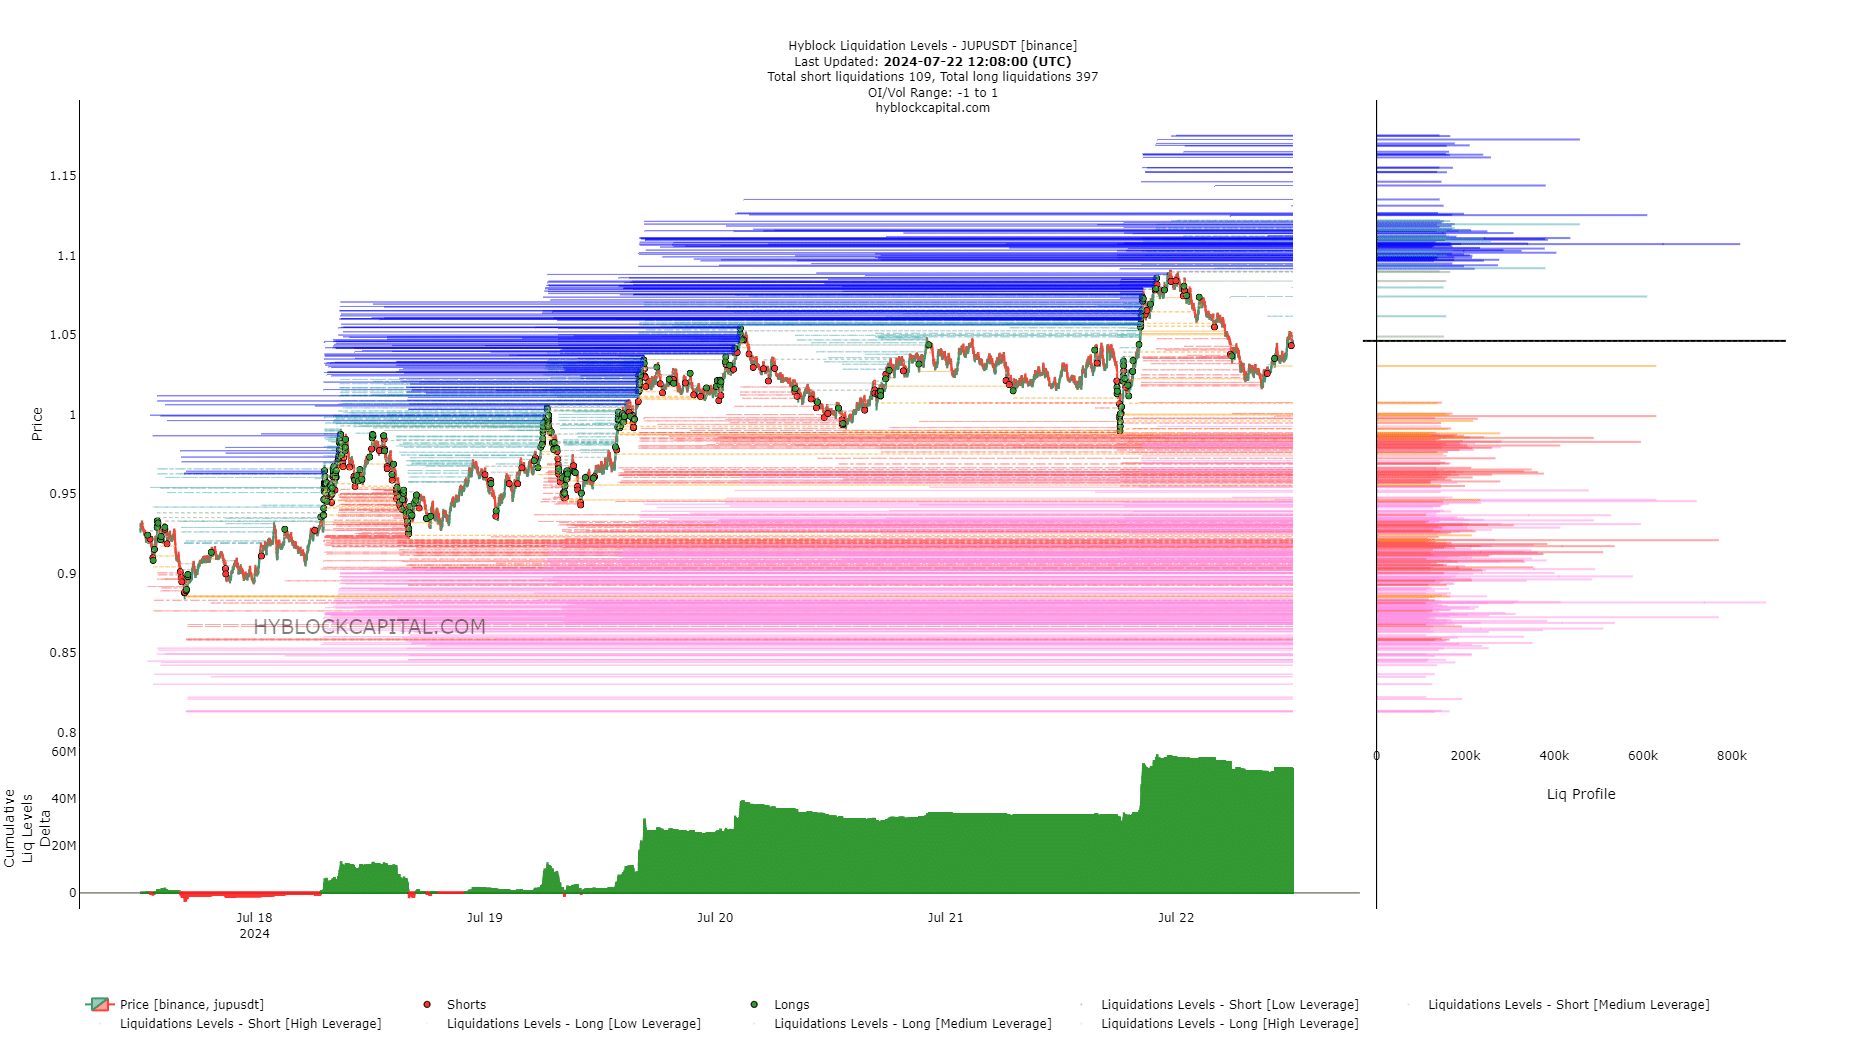
Source: Hyblock
The short-term liquidation levels showed a large skew toward long positions. The cumulative liq levels were high, which could set up the conditions for a long squeeze.
Is your portfolio green? Check out the JUP Profit Calculator
If that happens, the $0.97-$0.98 region is expected to serve as support.
Once the Futures participants balance out a bit more, Jupiter would have the room to expand higher, targeting $1.2 and potentially $1.4.
Disclaimer: The information presented does not constitute financial, investment, trading, or other types of advice and is solely the writer’s opinion.


