Jupiter: Can JUP’s 14% price rally avoid a liquidity sweep?
JUP rallied 14% as volume surged 113%, while traders increased leveraged exposure.

Jupiter [JUP] attracted a wave of fresh trading activity after surging 14.03% in 24 hours at press time, while volume exploded 113.83% to nearly $496 million across major exchanges.
The sharp increase in turnover indicated that traders actively chased the move rather than reacting to a temporary price fluctuation. JUP climbed to $0.2203 during the session, marking one of its strongest daily performances in recent weeks.
Rising participation accompanied the rally throughout the day, suggesting that interest had expanded beyond a small group of market participants. However, maintaining elevated activity remained important because sustained buying interest would determine whether the latest rally could develop into a broader trend reversal.
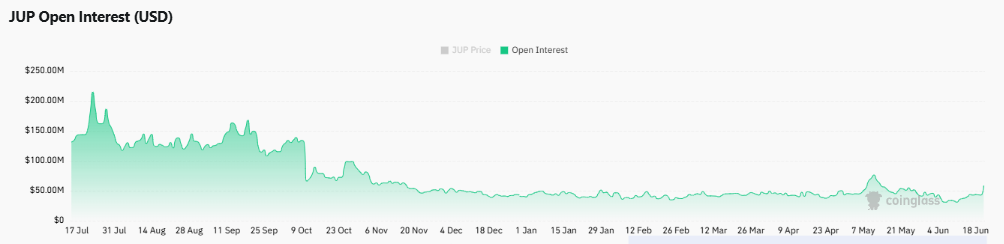
Why did JUP’s OI surge so sharply?
Derivatives traders increased their exposure aggressively as JUP advanced, reinforcing the bullish reaction seen across the market.
At press time, Open Interest (OI) rose 39.94% to $64.2 million, showing that new positions had entered the market instead of traders merely closing existing contracts. The expansion in leveraged exposure aligned closely with the rise in price and trading volume, creating a stronger confirmation signal than price appreciation alone.
In many cases, rising OI alongside a rally reflects growing conviction among participants. Still, leveraged positioning also increases volatility because rapid price swings can trigger liquidations in either direction.
For that reason, the growing futures activity suggested stronger trader engagement, yet it also raised the possibility of sharper moves should sentiment change during the coming sessions.
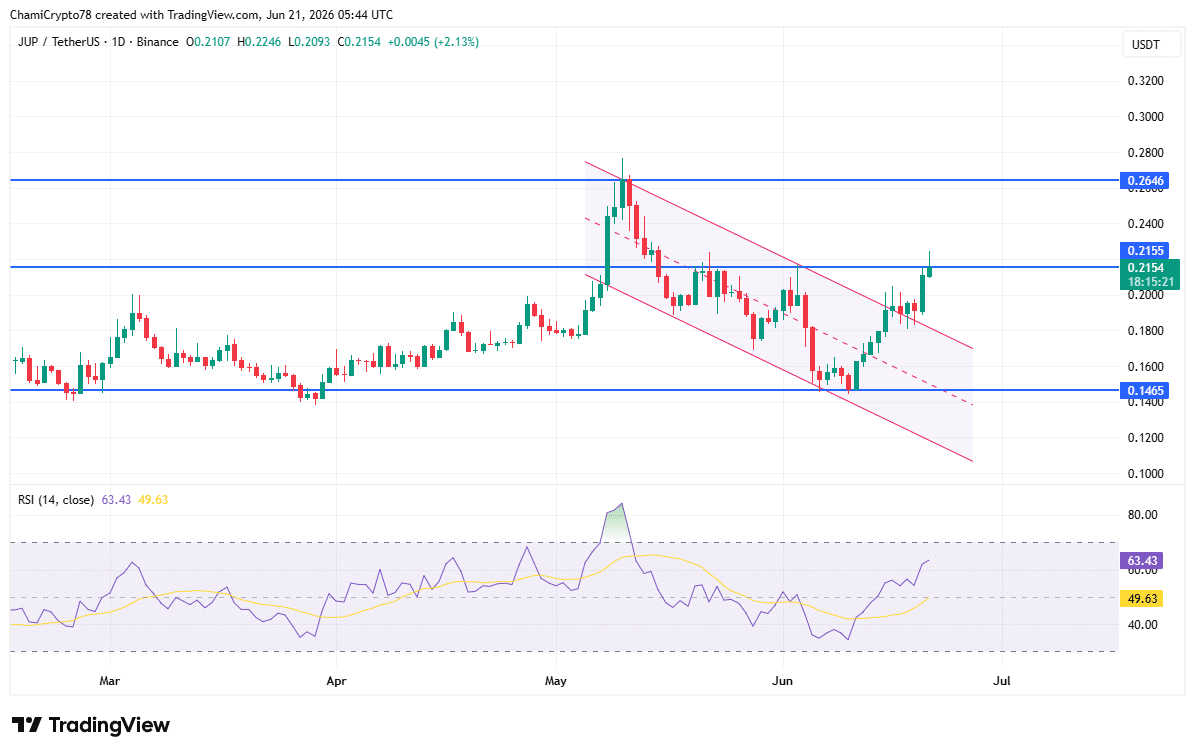
JUP channel breakout shifts market structure
Technical conditions improved significantly after JUP broke above a descending channel that had contained price action since May.
Buyers reclaimed the channel resistance and subsequently pushed the token above the key $0.2154 level, transforming a former resistance zone into an area of support. The breakout altered the short-term market structure and strengthened the recovery that began near the $0.1465 support region earlier this month.
At the time of writing, RSI reinforced the improvement in conditions, climbing to 63.43 from its signal line near 49.63. The indicator remained below overbought territory, suggesting the rally still had room to develop.
Meanwhile, the next major resistance sat near $0.2646. If buyers maintained control above $0.2154, price could challenge higher resistance levels. However, losing that reclaimed zone could encourage another period of consolidation.
Liquidity map hints at unfinished business below
Despite the bullish breakout, liquidation data continued to highlight a different risk.
The Binance JUP/USDT heatmap showed a larger concentration of liquidity below the current price than above it. The most notable clusters remained near $0.20 and across the broader $0.19 to $0.195 region. These zones contained significantly more leveraged positions than the overhead liquidity pockets between $0.22 and $0.23.
Markets often gravitate toward large liquidity pools because liquidations create opportunities for major participants. Therefore, the imbalance suggested that downside levels still attracted attention despite the recent rally.
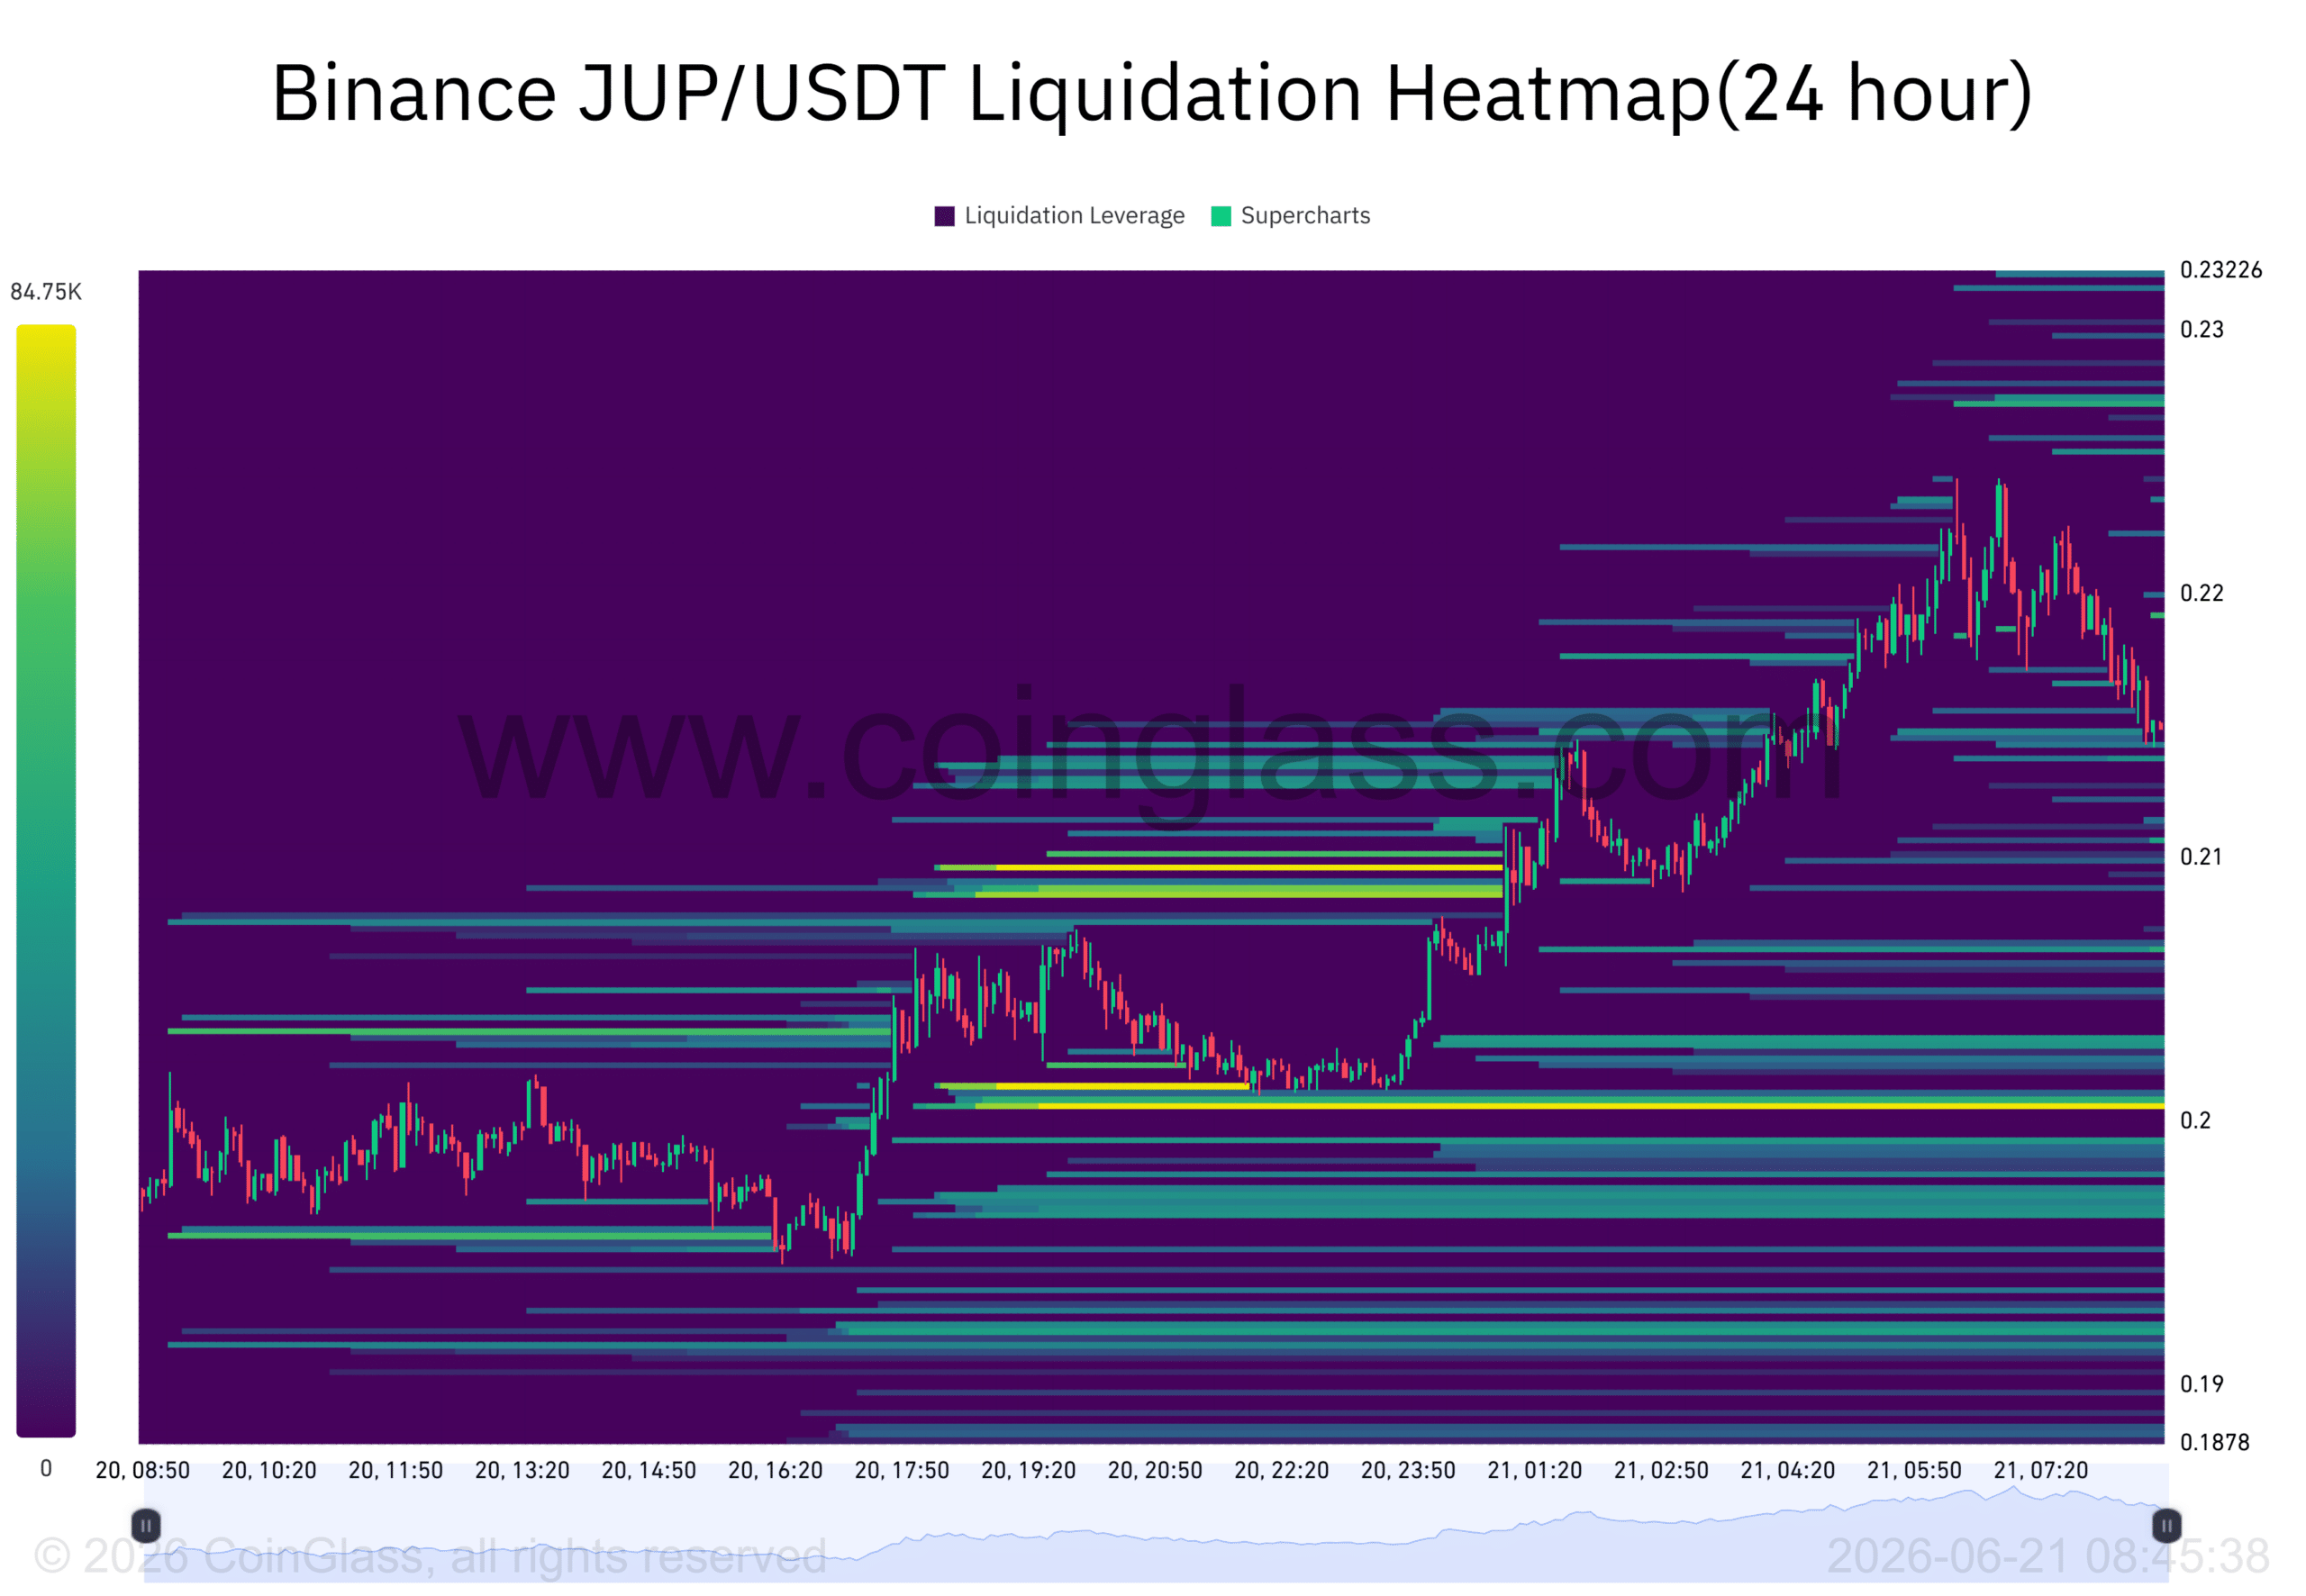
Although buyers had regained short-term control, the heavier concentration beneath price indicated that JUP could revisit lower levels before attempting another sustained advance toward higher resistance zones.
Final Summary
- JUP attracted fresh demand as price, volume, and Open Interest increased together.
- Larger liquidity clusters remained below price, keeping pullback risks in focus.