Jupiter [JUP] price prediction – 36% hike, but is the risk of profit-taking still there?
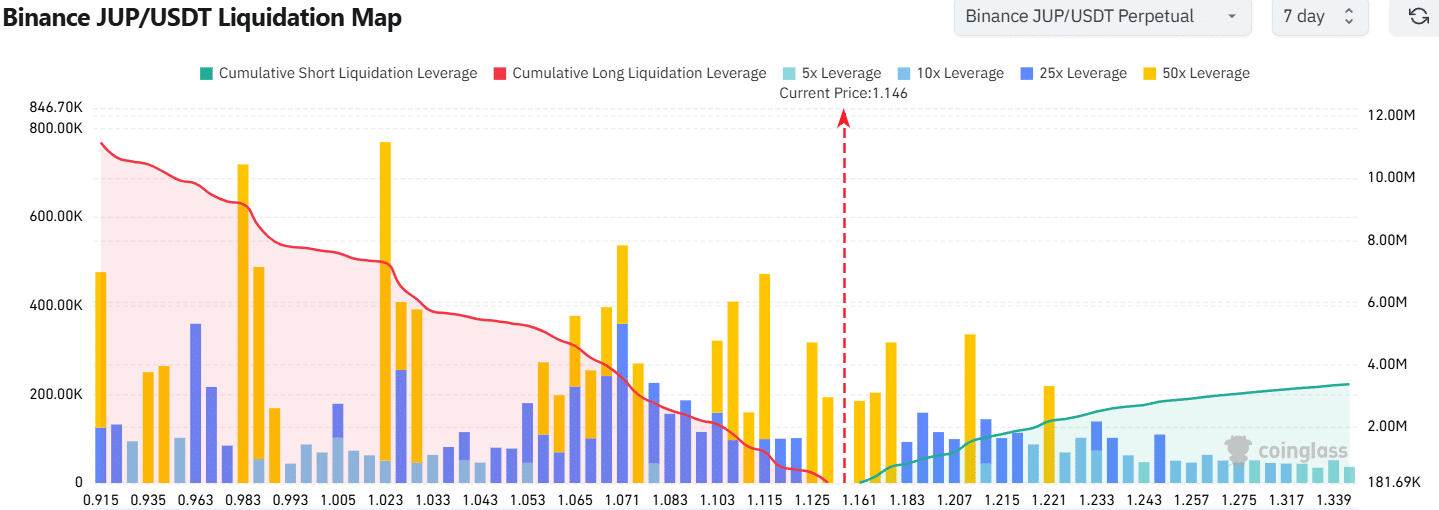
Liquidation map noted more cumulative liquidation leverage to the south, than to the north.
![Jupiter [JUP] price prediction - 36% hike, but is the risk of profit-taking still there?](https://ambcrypto.com/wp-content/uploads/2025/01/Jupiter-Featured.webp)
- Jupiter rocketed past the local resistance zone at $0.95, and the price was just below the $1.15 resistance at press time
- There is potential for a drop to $1.06 in the near future
Jupiter [JUP] saw a 36.76% hie on Saturday, 18 January. The last 24 hours of trading saw 34% gains and a 678% hike in the daily trading volume for Jupiter. This seemed to be a strongly bullish sign for the altcoin.
The altcoin’s market structure was bullish on the daily and that 4-hour charts. However, there may be potential for a retracement towards $1. How deep could this dip go? Strong support was at $1.06, nearly 9% below the market price at press time.
JUP bulls challenge the $1.15 resistance
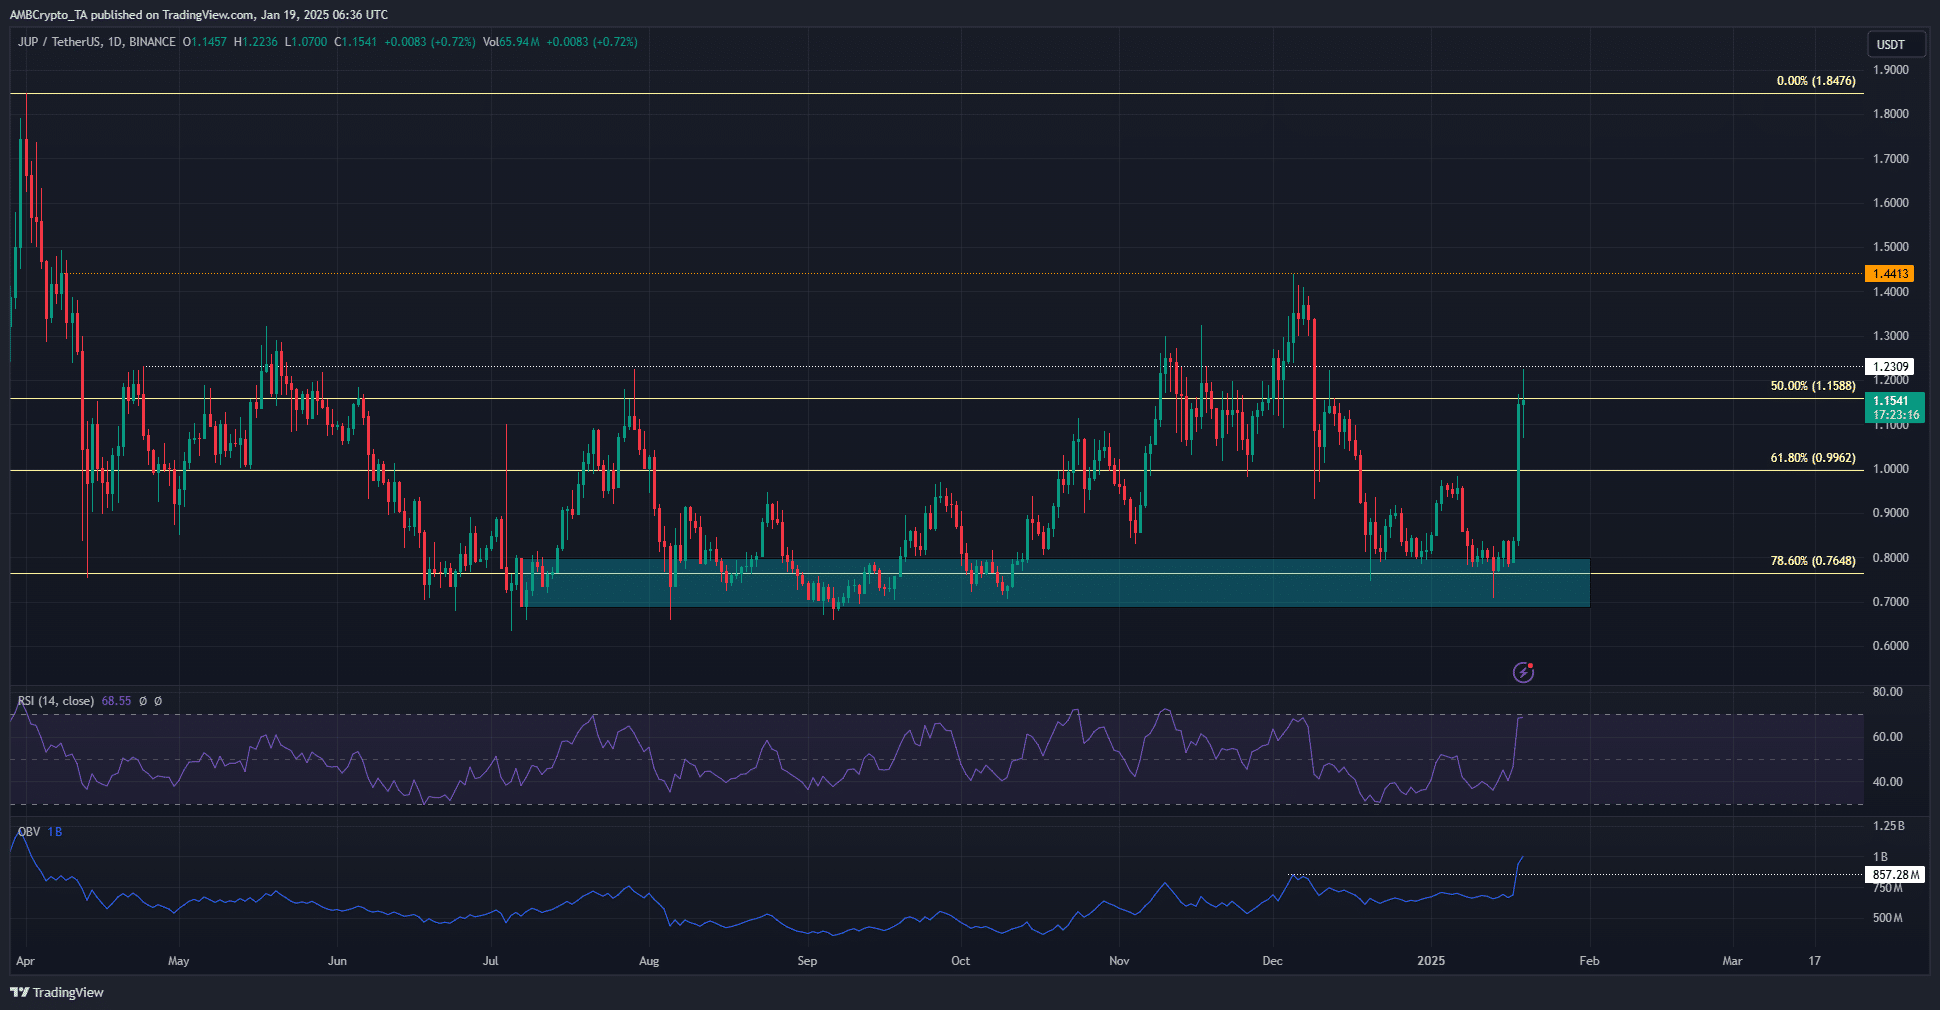
Over the last nine months, the bulls have stoutly defended the 78.6% retracement level at $0.76. These retracement levels were plotted based on Jupiter’s rally in March from $0.47 to $1.84.
The bullish daily structure was encouraging, and the RSI was well above neutral 50, indicating strong upward momentum. This momentum was accompanied by heightened demand. The OBV shot past a local high to reflect increased buying pressure too.
Surging demand and momentum could be enough to carry JUP past its local resistances at $1.15 and $1.23. Over the next week or two, it is likely that the $1.44 local highs will be challenged once again.
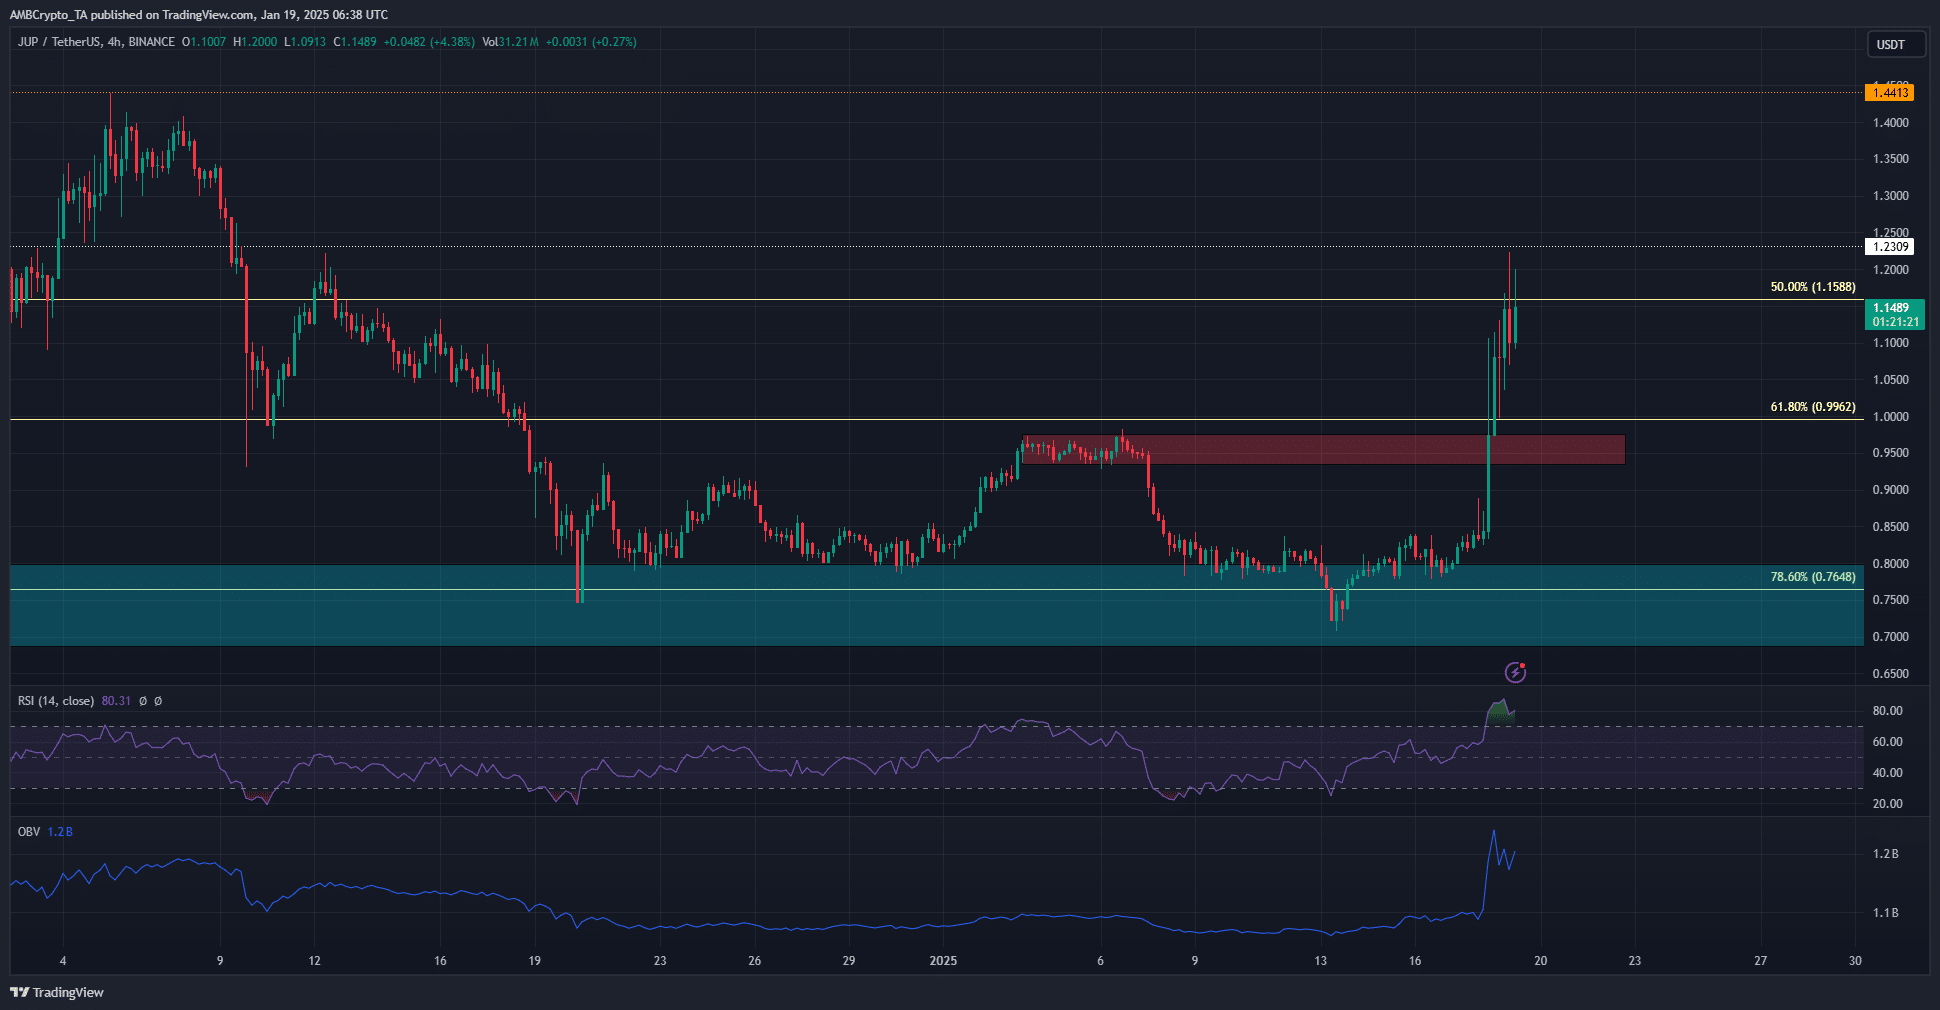
The H4 chart highlighted the intense momentum of the last few days. The local resistance at $0.95 and $0.99 were swept aside with ease and barely faced a retest as the crypto’s price raced higher.
The 4-hour chart’s momentum was oversold, which was not necessarily bearish. However, the OBV dip over the last few sessions indicated some profit-taking. A move towards the $0.95-$1 support zone might be possible in the coming days. If tested, this area would present a buying opportunity.
Read Jupiter’s [JUP] Price Prediction 2025-26
The liquidation map noted more cumulative liquidation leverage to the south, than to the north. Therefore, it is possible that a liquidity hunt and a short-term price dip could commence. The $1.11 and $1.06 levels would be the short-term targets in case of such a dip.
Disclaimer: The information presented does not constitute financial, investment, trading, or other types of advice and is solely the writer’s opinion


