Kaspa price prediction – KAS buyers have THESE bullish targets in mind!

- KAS retained a bearish daily structure on the price charts
- Liquidity clusters around $0.133 seemed to be a short-term target
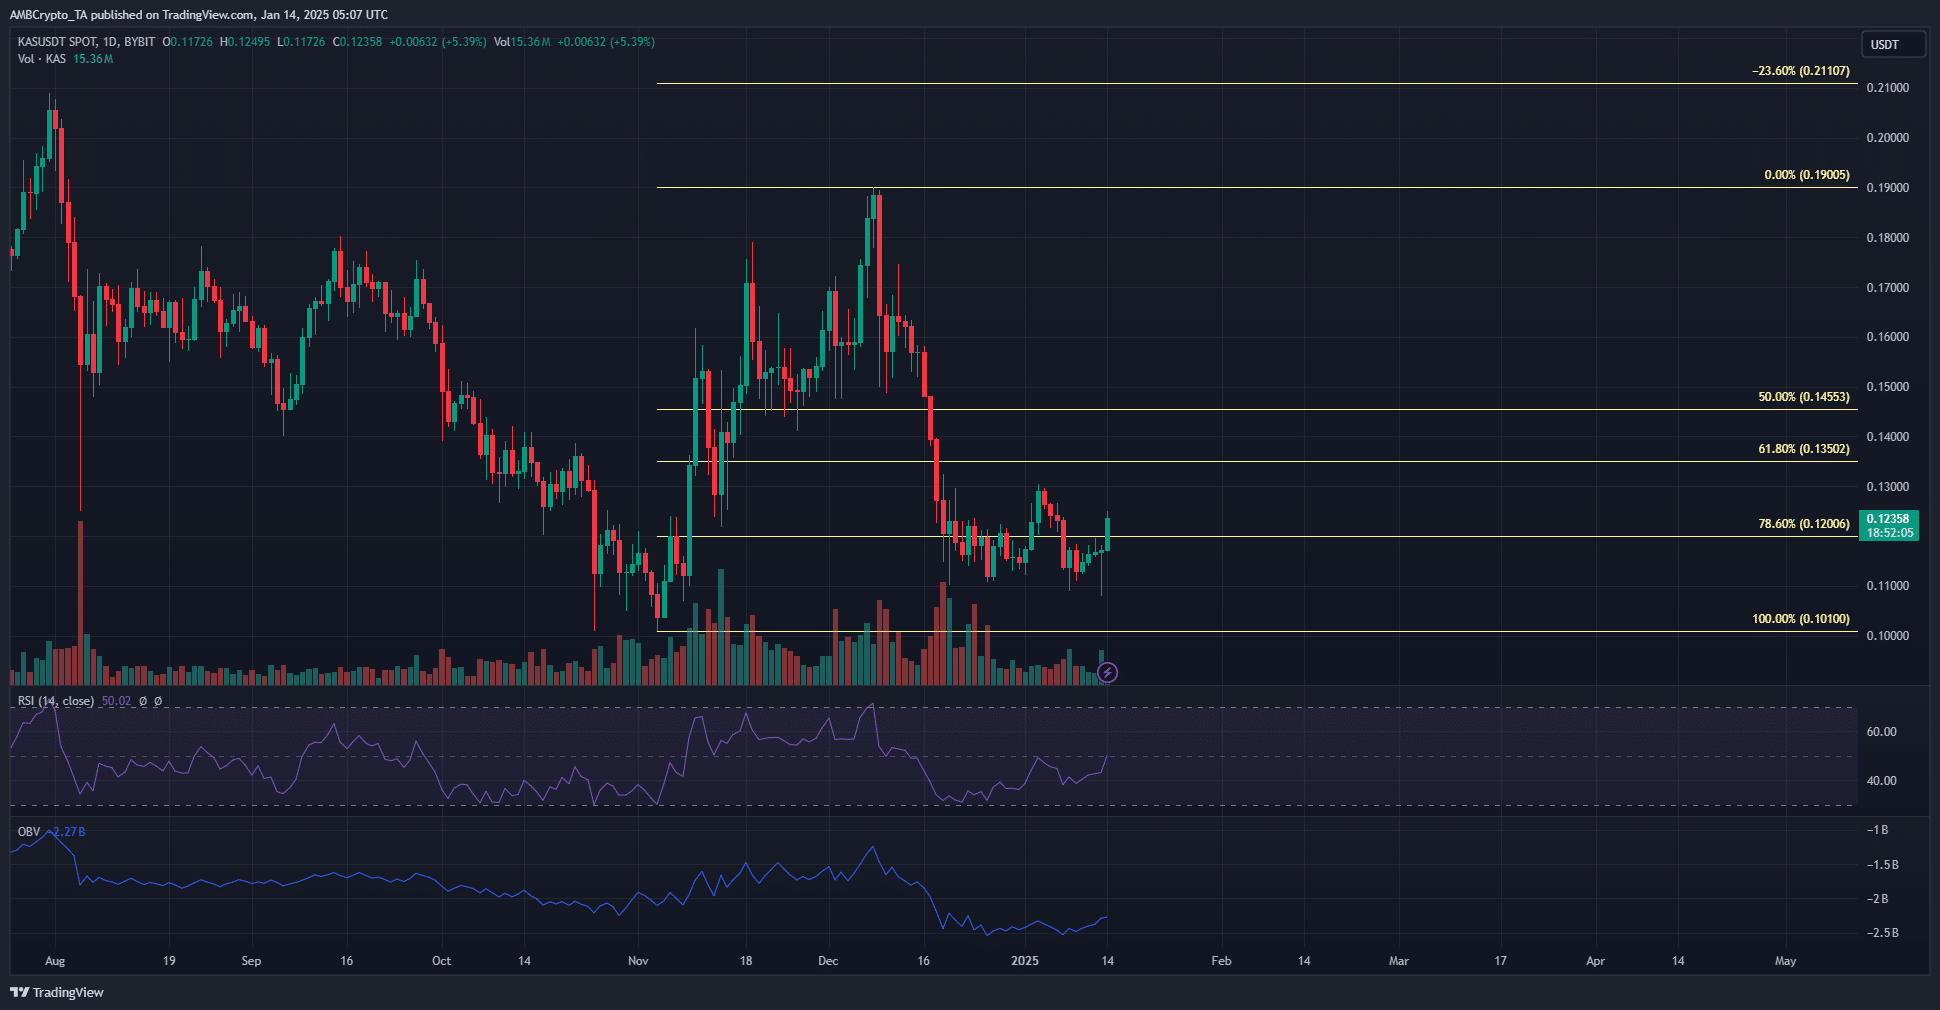
Kaspa [KAS] gained by 5.4% on Tuesday and it could be set for more gains soon. At the time of writing, it still had a bearish structure on the daily timeframe, but the bulls’ defense of the $0.11 region was solid. And yet, the swift retrace from the $0.19-level in December is a worry that has not been addressed yet.
Buying pressure slowly on the rise
The structure was bearish because the lower high on the daily timeframe was set at $0.1291 during the early January rally. This is the level that bulls must beat to shift the bias bullishly on the 1-day timeframe.
The RSI was at 50 and on the verge of crossing over into bullish territory. Similarly, the OBV was also steadily rising. However, like the price, the OBV too was on a pronounced downtrend. The altcoin’s latest move made a higher high on the OBV – An early sign of strength from the buyers.
Therefore, it can be expected that a move past $0.13 would commence. Besides, the $0.11 region has been a stern demand zone since March 2024. KAS has traded within a range-like formation from the $0.11 to $0.19-levels.
Hence, swing traders have an opportunity to go long at or near current market prices.
Magnetic zones to the north likely to pull KAS higher
Source: Coinglass
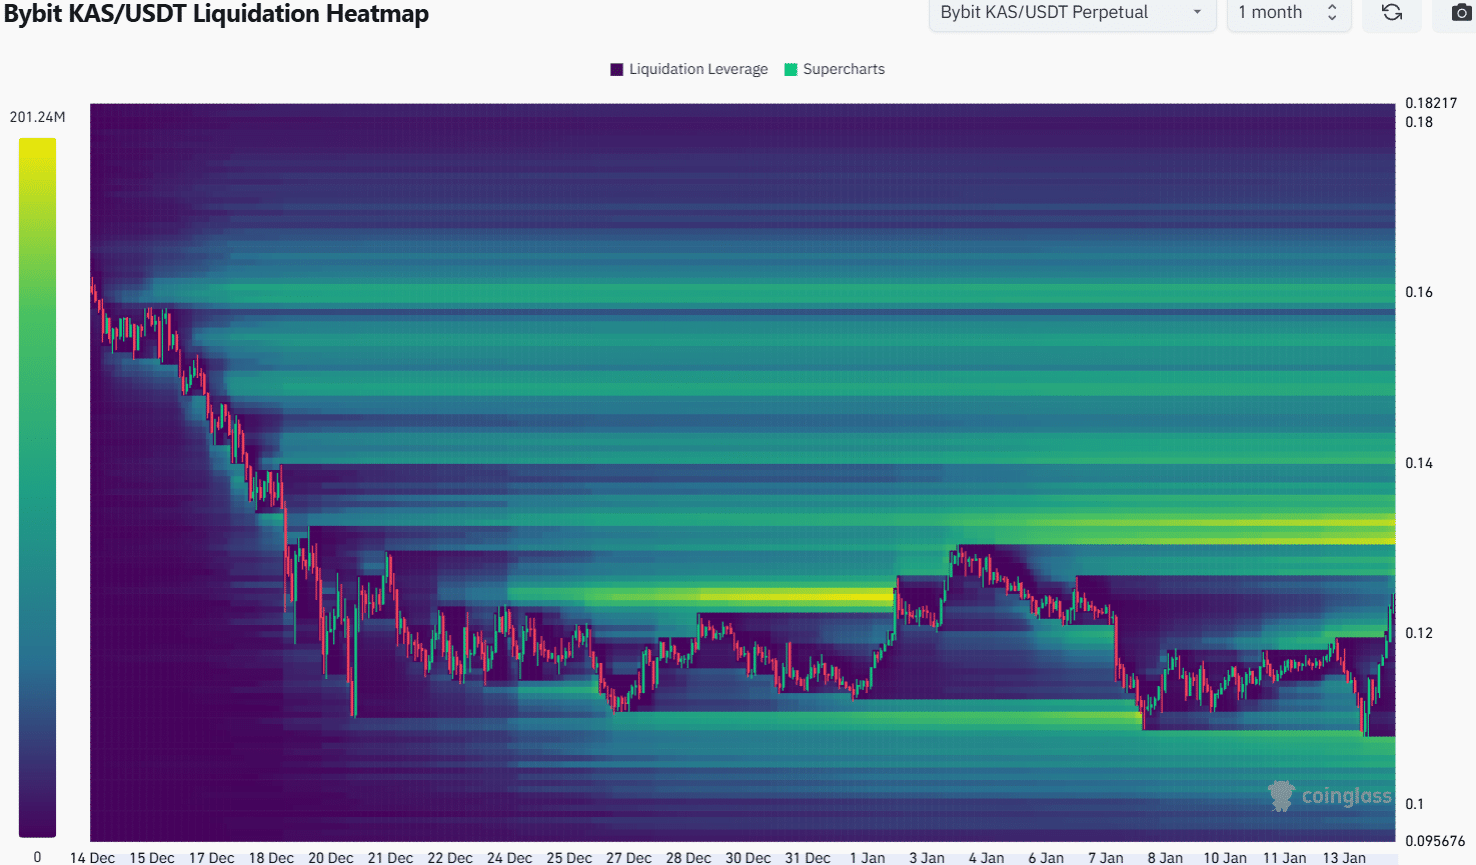
The 1-month liquidation heatmap revealed that the $0.13-$0.133 zone had a high concentration of liquidation levels. It was credible that KAS would push north to sweep this liquidity pocket in the coming days.
Source: Coinglass
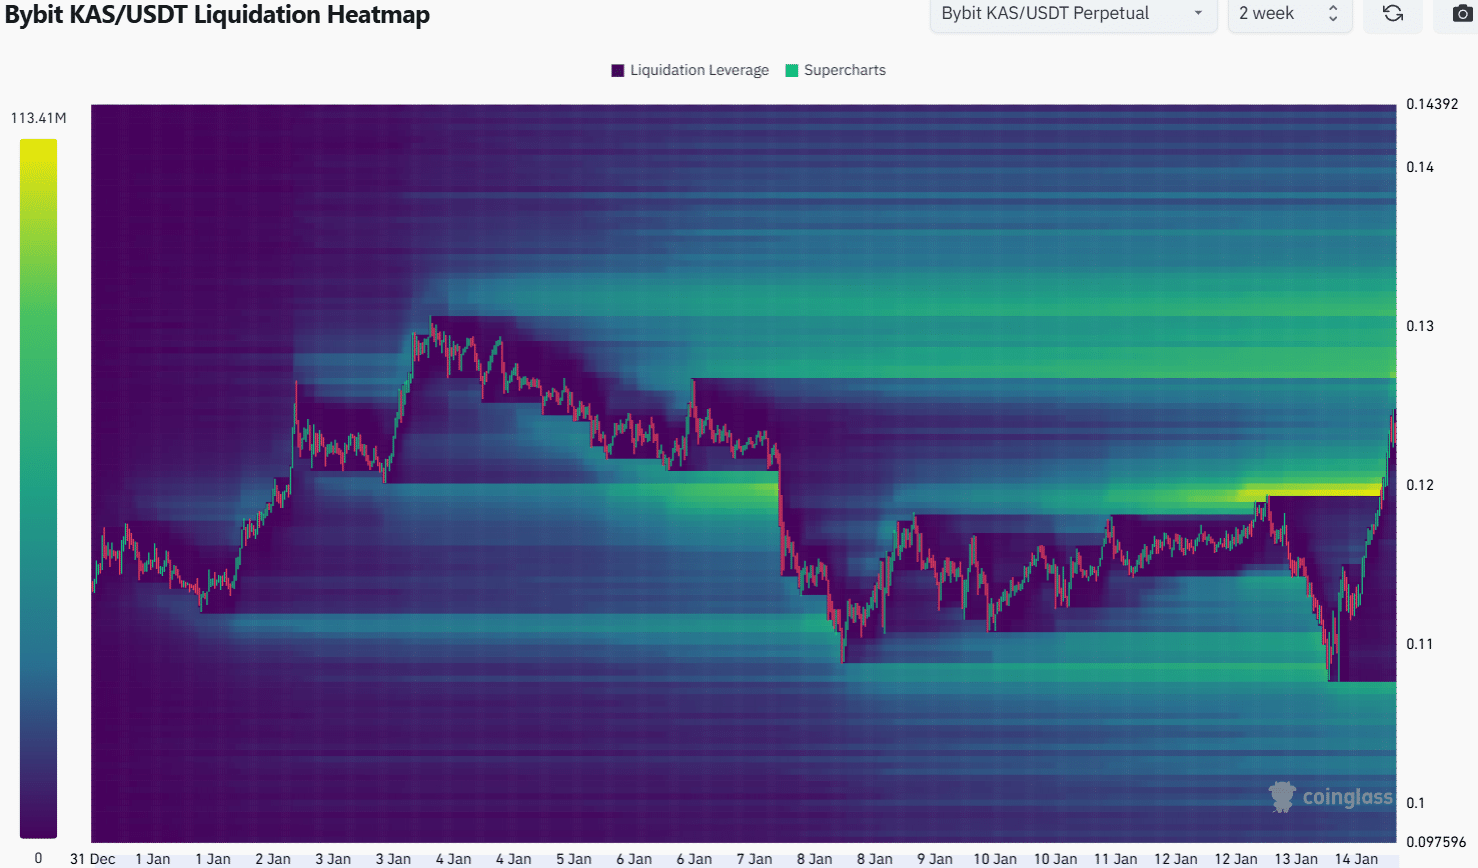
The 2-week liquidation heatmap revealed that the latest move higher was preceded by a liquidity hunt towards $0.11. Therefore, if the pattern repeats itself in the coming days, Kaspa is likely to hit $0.13-$0.14 soon and then trade sideways.
Is your portfolio green? Check the Kaspa Profit Calculator
This consolidation would build up liquidity in both directions around the price, and KAS could sweep one side before rebounding to the other. If Bitcoin [BTC] rallies, a short KAS move south after $0.13 before new local highs can be anticipated.
Disclaimer: The information presented does not constitute financial, investment, trading, or other types of advice and is solely the writer’s opinion

