Key levels for Solana bulls and bears to plan their next moves

Disclaimer: The information presented does not constitute financial, investment, trading, or other types of advice and is solely the writer’s opinion.
- The 4-hour and daily market structures of Solana, at press time, were bullish.
- The range formation gives out a clear game plan for buyers and sellers.
Solana has recovered remarkably from the losses it posted in November and December, especially for a multibillion-dollar market-cap asset. Further gains are likely, especially based on the higher timeframe trend. Is it possible that the expectation of a breakout will trap bulls before a reversal?
Read Solana’s Price Prediction 2023-24
The AI bot sets a bullish target of $54 in 2023, but there was a long way to go for SOL. Bitcoin hasn’t broken above $25k yet, and this rally was more likely to be a bear market rally than the beginning of a bull market.
A breakout and retest of the range highs could signal a move up to $37
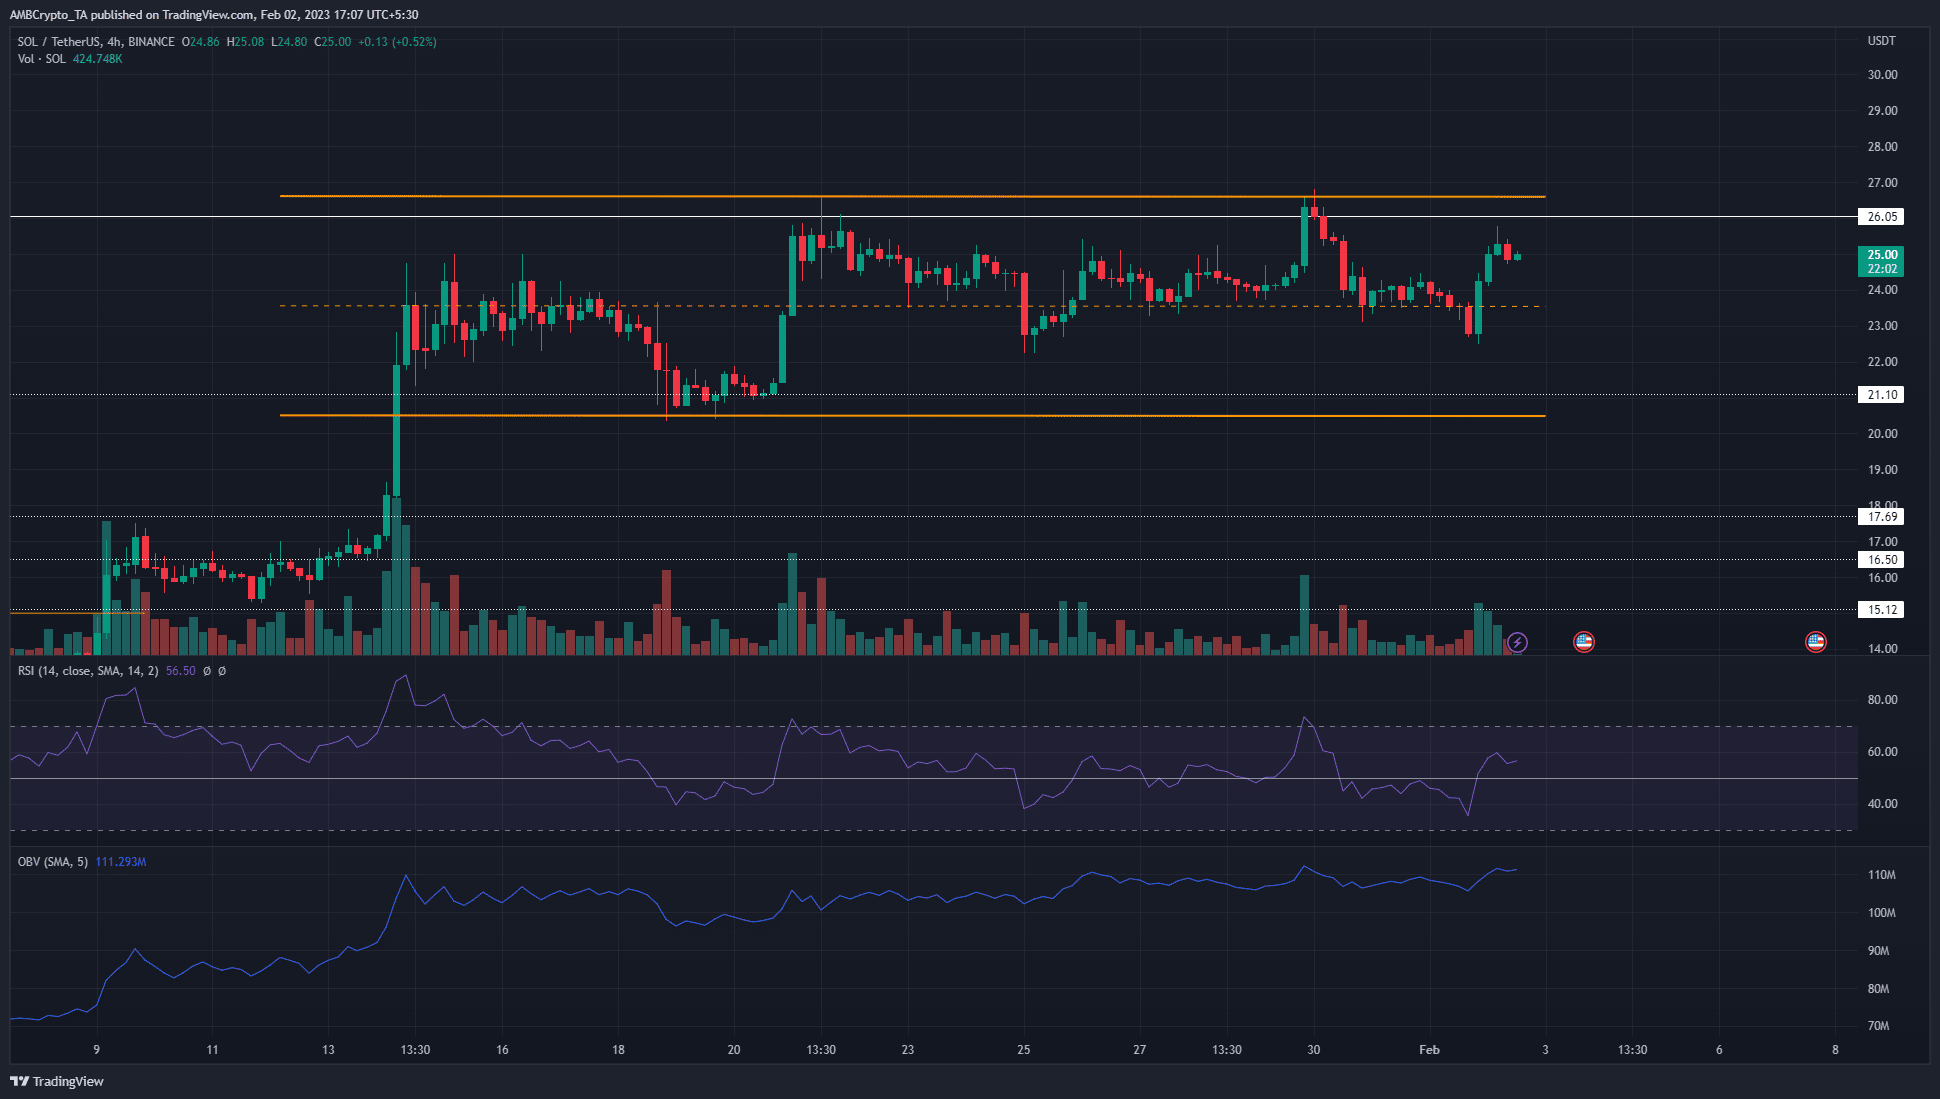
Solana traded within a range (orange) between $20.4 and $26.6, with the mid-point at $23.5 since mid-January. Above $26.6, $30.7 is the next major resistance level. However, the $26-$27 region itself presents a significant zone of resistance.
This is because it represents the lows of a range that SOL traded within from May to November. On multiple occasions, a retest of this zone saw Solana bounce higher. This was broken during the November crash.
Is your portfolio green? Check the Solana Profit Calculator
Moreover, when ranges form, they are more likely to continue than to breakout when the extremes are retested. This meant that a move back to $26.6 will offer a shorting opportunity, with a stop-loss above $27 and take-profit at the mid-range of $23.5.
A session close above $27 and a retest of the $26 belt would flip this bias. In that case, buyers can long a breakout and use $30.7, $33, and $37.3 to take profits at.
At press time, the RSI showed some bullish momentum with a reading of 56, while the OBV saw minor gains in the past three days.
The Open Interest saw an upward move after SOL’s bounce from $23
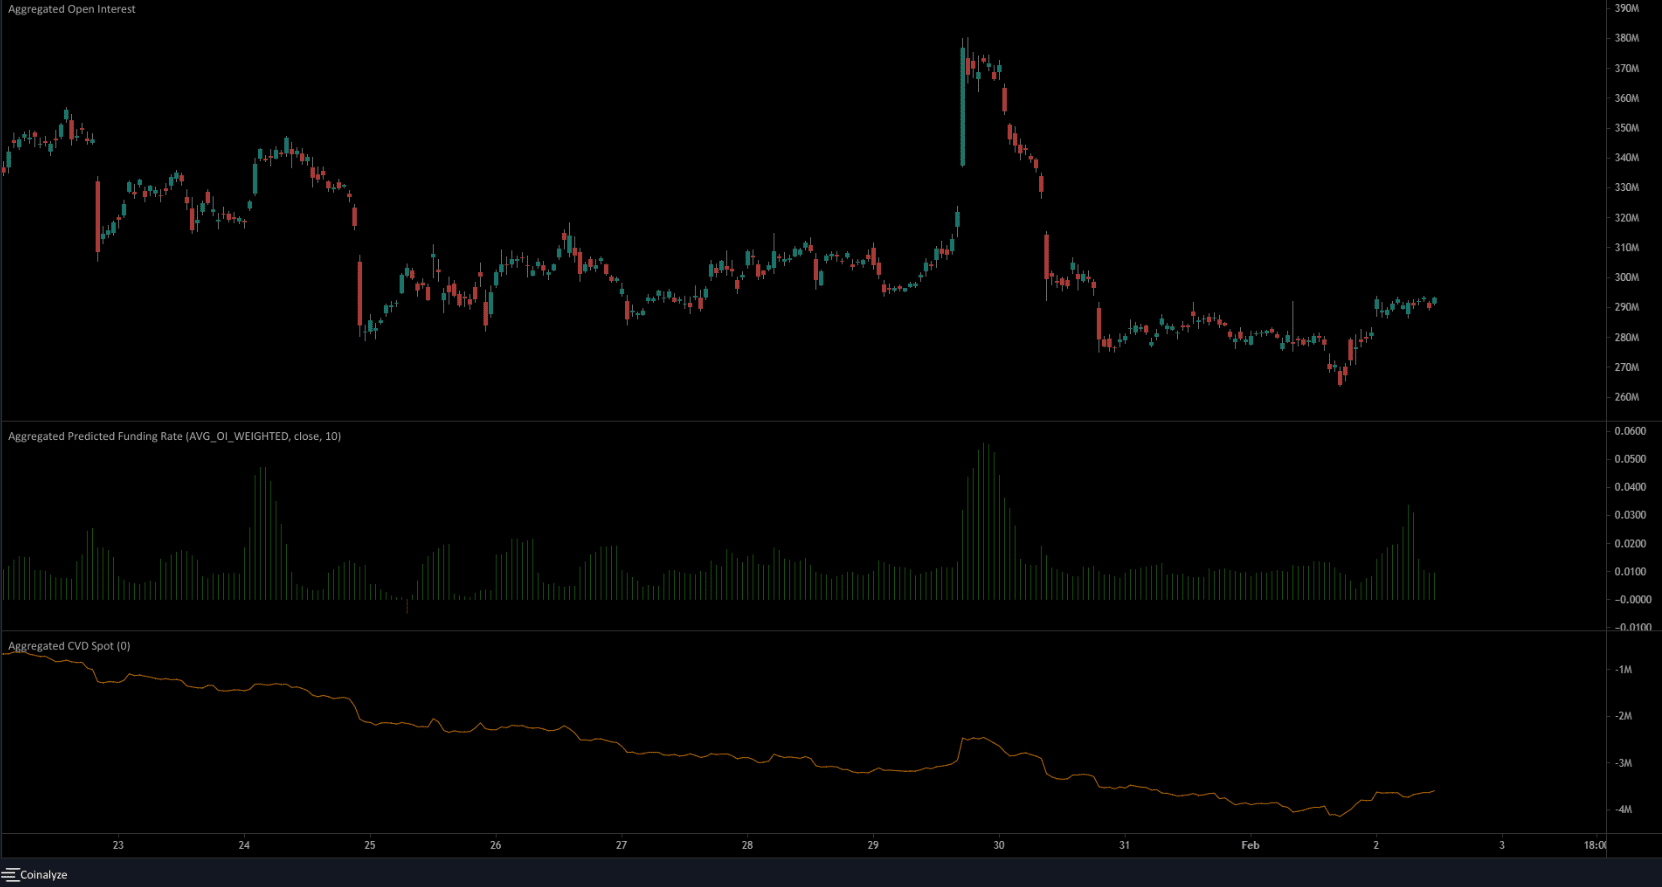
The 1-hour chart of Solana on Coinalyze showed the spot CVD began to pick up over the past few days. This, in order to underline buying pressure in the market. It was an encouraging development, especially as SOL is close to the $26 resistance.
The predicted funding rate remained positive, as it has since mid-January. Meanwhile, the Open Interest spiked upward alongside SOL’s bounce from $23, which was a sign of bullish intent. A continued rise in OI will likely be followed by a breakout above the range.


