
Will JASMY break THIS key resistance? Watch out for 2 major signs!

- Traders should closely monitor the $11.2 resistance and the pennant formation for any breakout or breakdown scenarios
- Derivatives market data revealed mixed sentiment with rising Open Interest and falling volume
Chainlink (LINK) recently encountered significant downward momentum, with its price gravitating toward crucial support levels. Despite a brief attempt to stabilize, the broader market uncertainties have kept the bulls from regaining significant ground.
At the time of writing, LINK was trading at around $10.3, reflecting a rather cautious market position as traders await more decisive movements.
LINK bears kept the price below EMAs
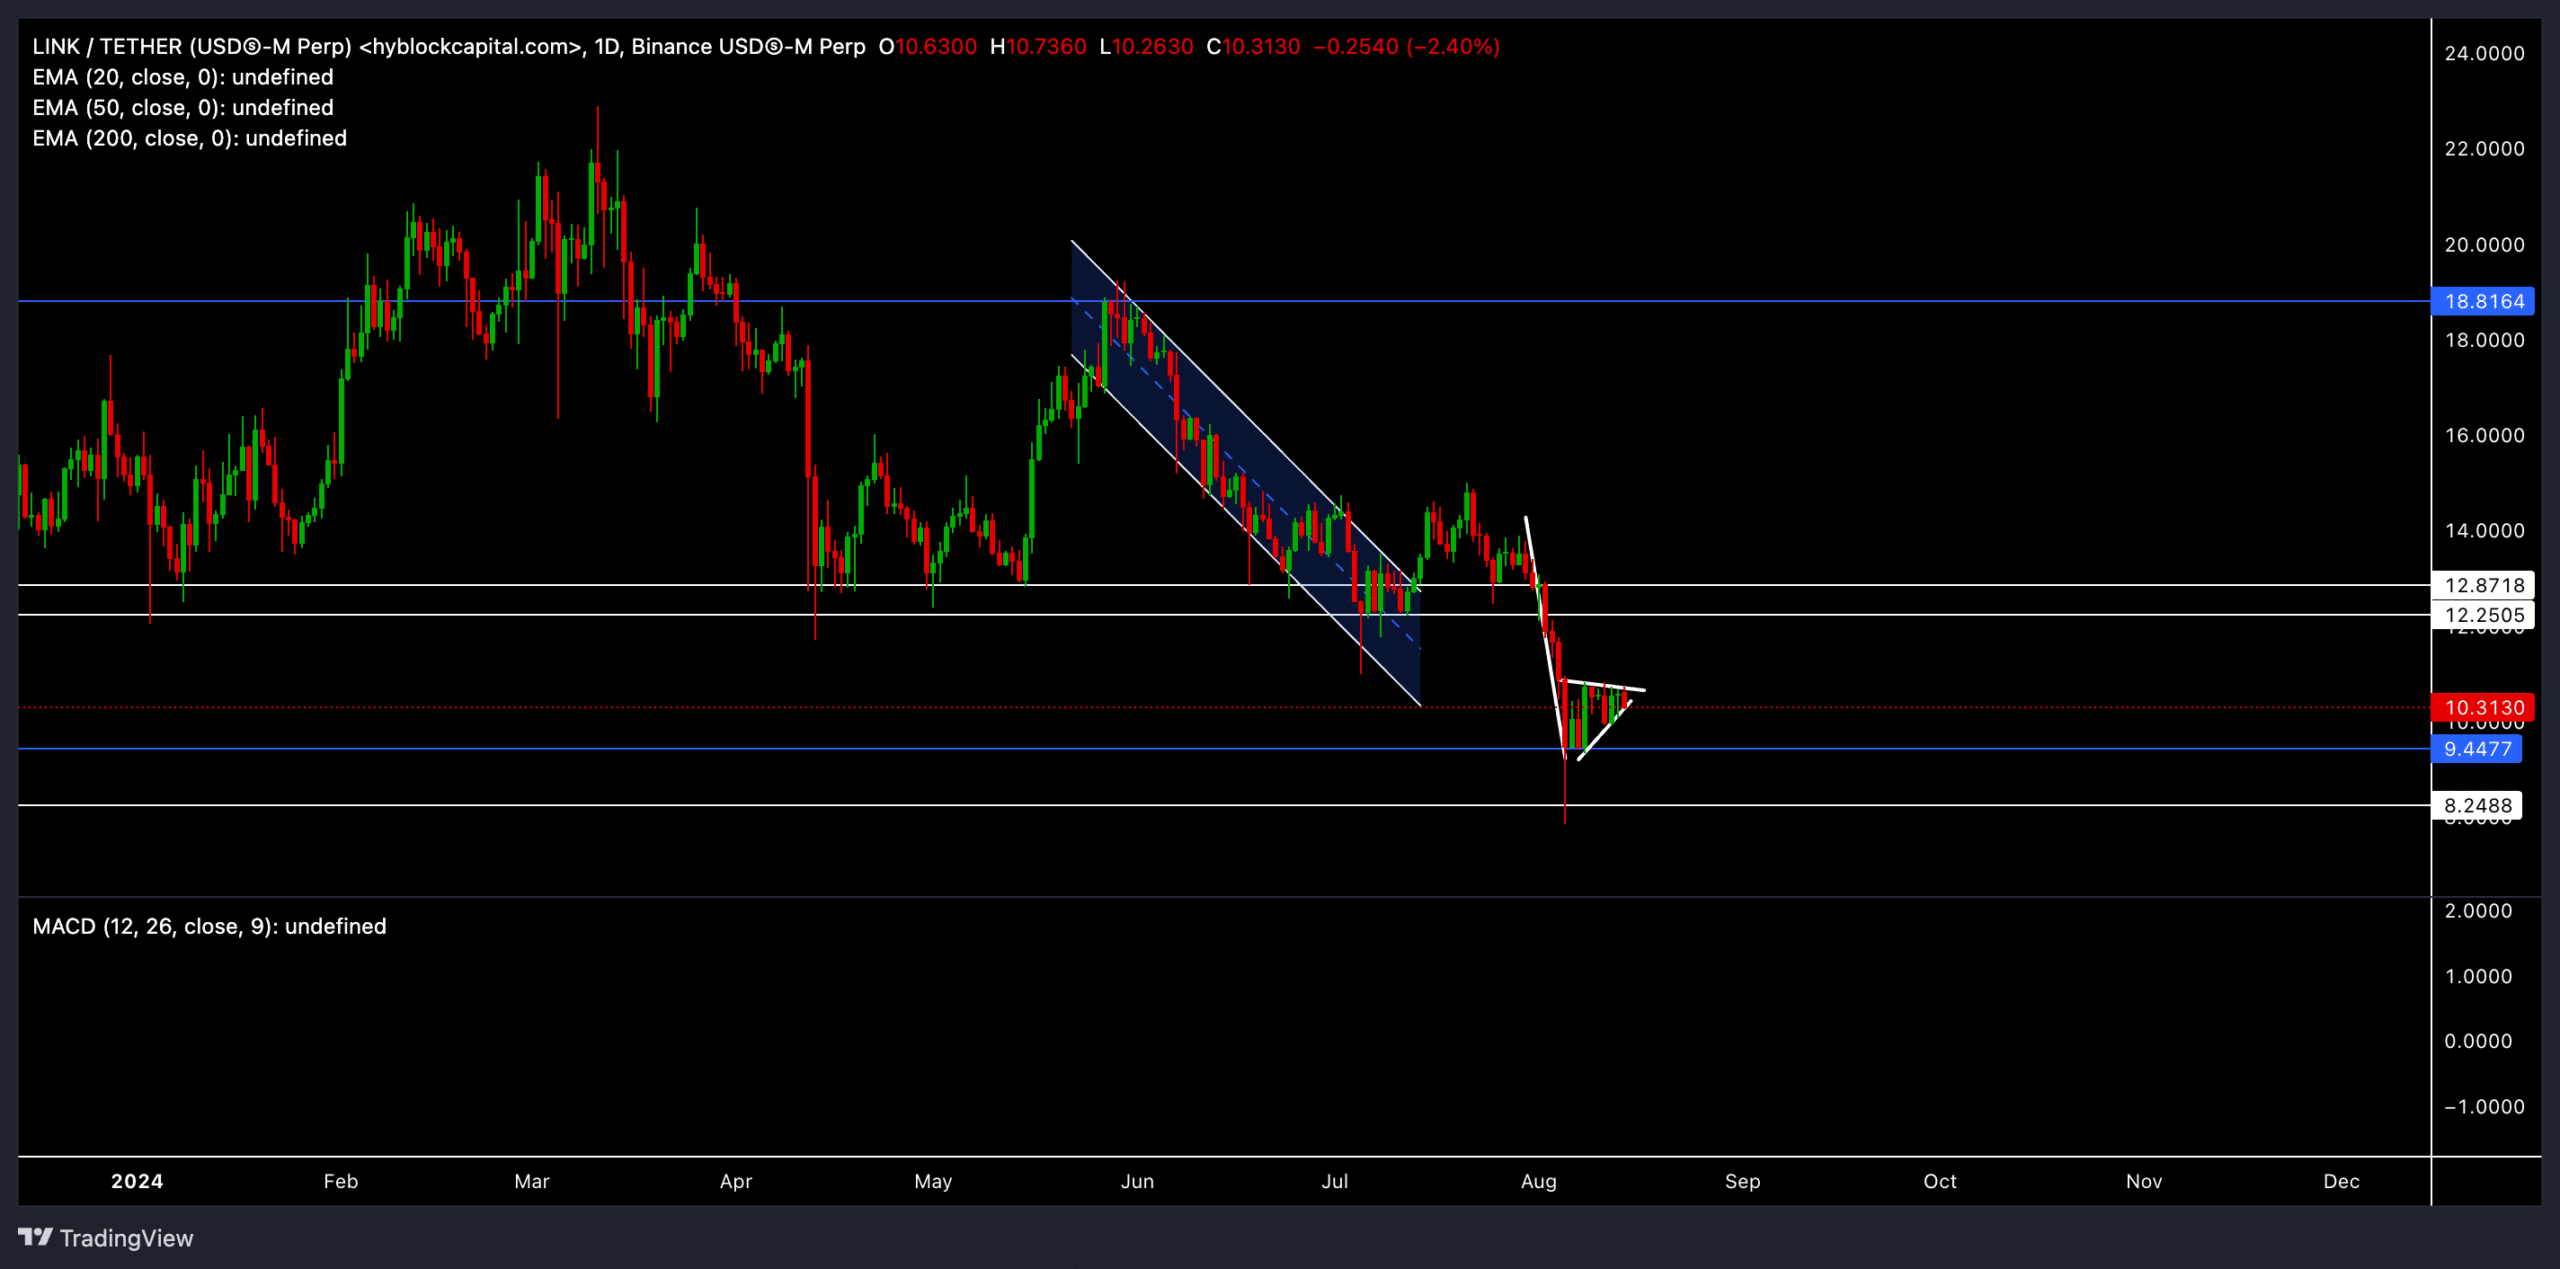
Source: TradingView, LINK/USDT
The daily chart revealed that LINK was trapped in a downward channel for the past several months. Although the price broke out of the channel, the bulls were unable to find a rally above the 200 EMA resistance.
As a result, the price fall below the 20 EMA further intensified the bearish sentiment. The 50 EMA and 200 EMA were positioned at $12.52 and $14.25 at press time, respectively, which may act as strong barriers in case of any potential bullish reversal.
The press time price action chalked out a bearish pennant pattern, hinting at a continuation of the downtrend if a breakout below $10 materializes. However, a successful breach of the $11.26 resistance could potentially invalidate this bearish setup and lead to a retest of the 50 EMA.
The MACD indicator on the daily timeframe underlined some bearish momentum too, with the MACD line dipping below the signal line. The histogram also indicated a slight ease in bearish pressure. In fact, at the time of writing, the readings suggested that any upside in the short term may be limited.
Key levels to watch out for!
The immediate support level was at $9.44. If the price breaks below this level, it could lead to further downside, with the next support around $8.000.
On the upside, if the bulls can push the price above the 20 EMA at $11.27, it could trigger a short-term rally towards the $12.25 and $12.87 resistance levels.
Derivates data revealed THIS

Source: Coinglass
Recent derivatives data from Coinglass highlighted a 15.88% decrease in trading volume, with Open Interest seeing a slight hike of 2.61% to $136.05M. The 24-hour long/short ratio across exchanges was near neutral at 0.9826, but a closer look at individual platforms like Binance and OKX highlighted a higher long bias, indicating mixed sentiment among traders.
Despite the press time price hovering near support levels, a combination of declining volumes and rising Open interest typically signals caution. Especially since it could mean that traders are hesitant to commit fully to either direction.


