Litecoin: A potential breakout would mean this for investors
Litecoin’s (LTC) July-November 2021 bull run saw exceptional gains that halted near the 61.8% Fibonacci resistance. Since then, LTC has steeply downturned within the bounds of multiple reversal patterns.
The wider market correction stalled LTC’s northbound trajectory from the 23.6% Fibonacci resistance. Now, a potential break from its current reversal pattern could brace the alt for a test of the $114-zone. At press time, LTC traded at $104.68.
LTC Daily Chart
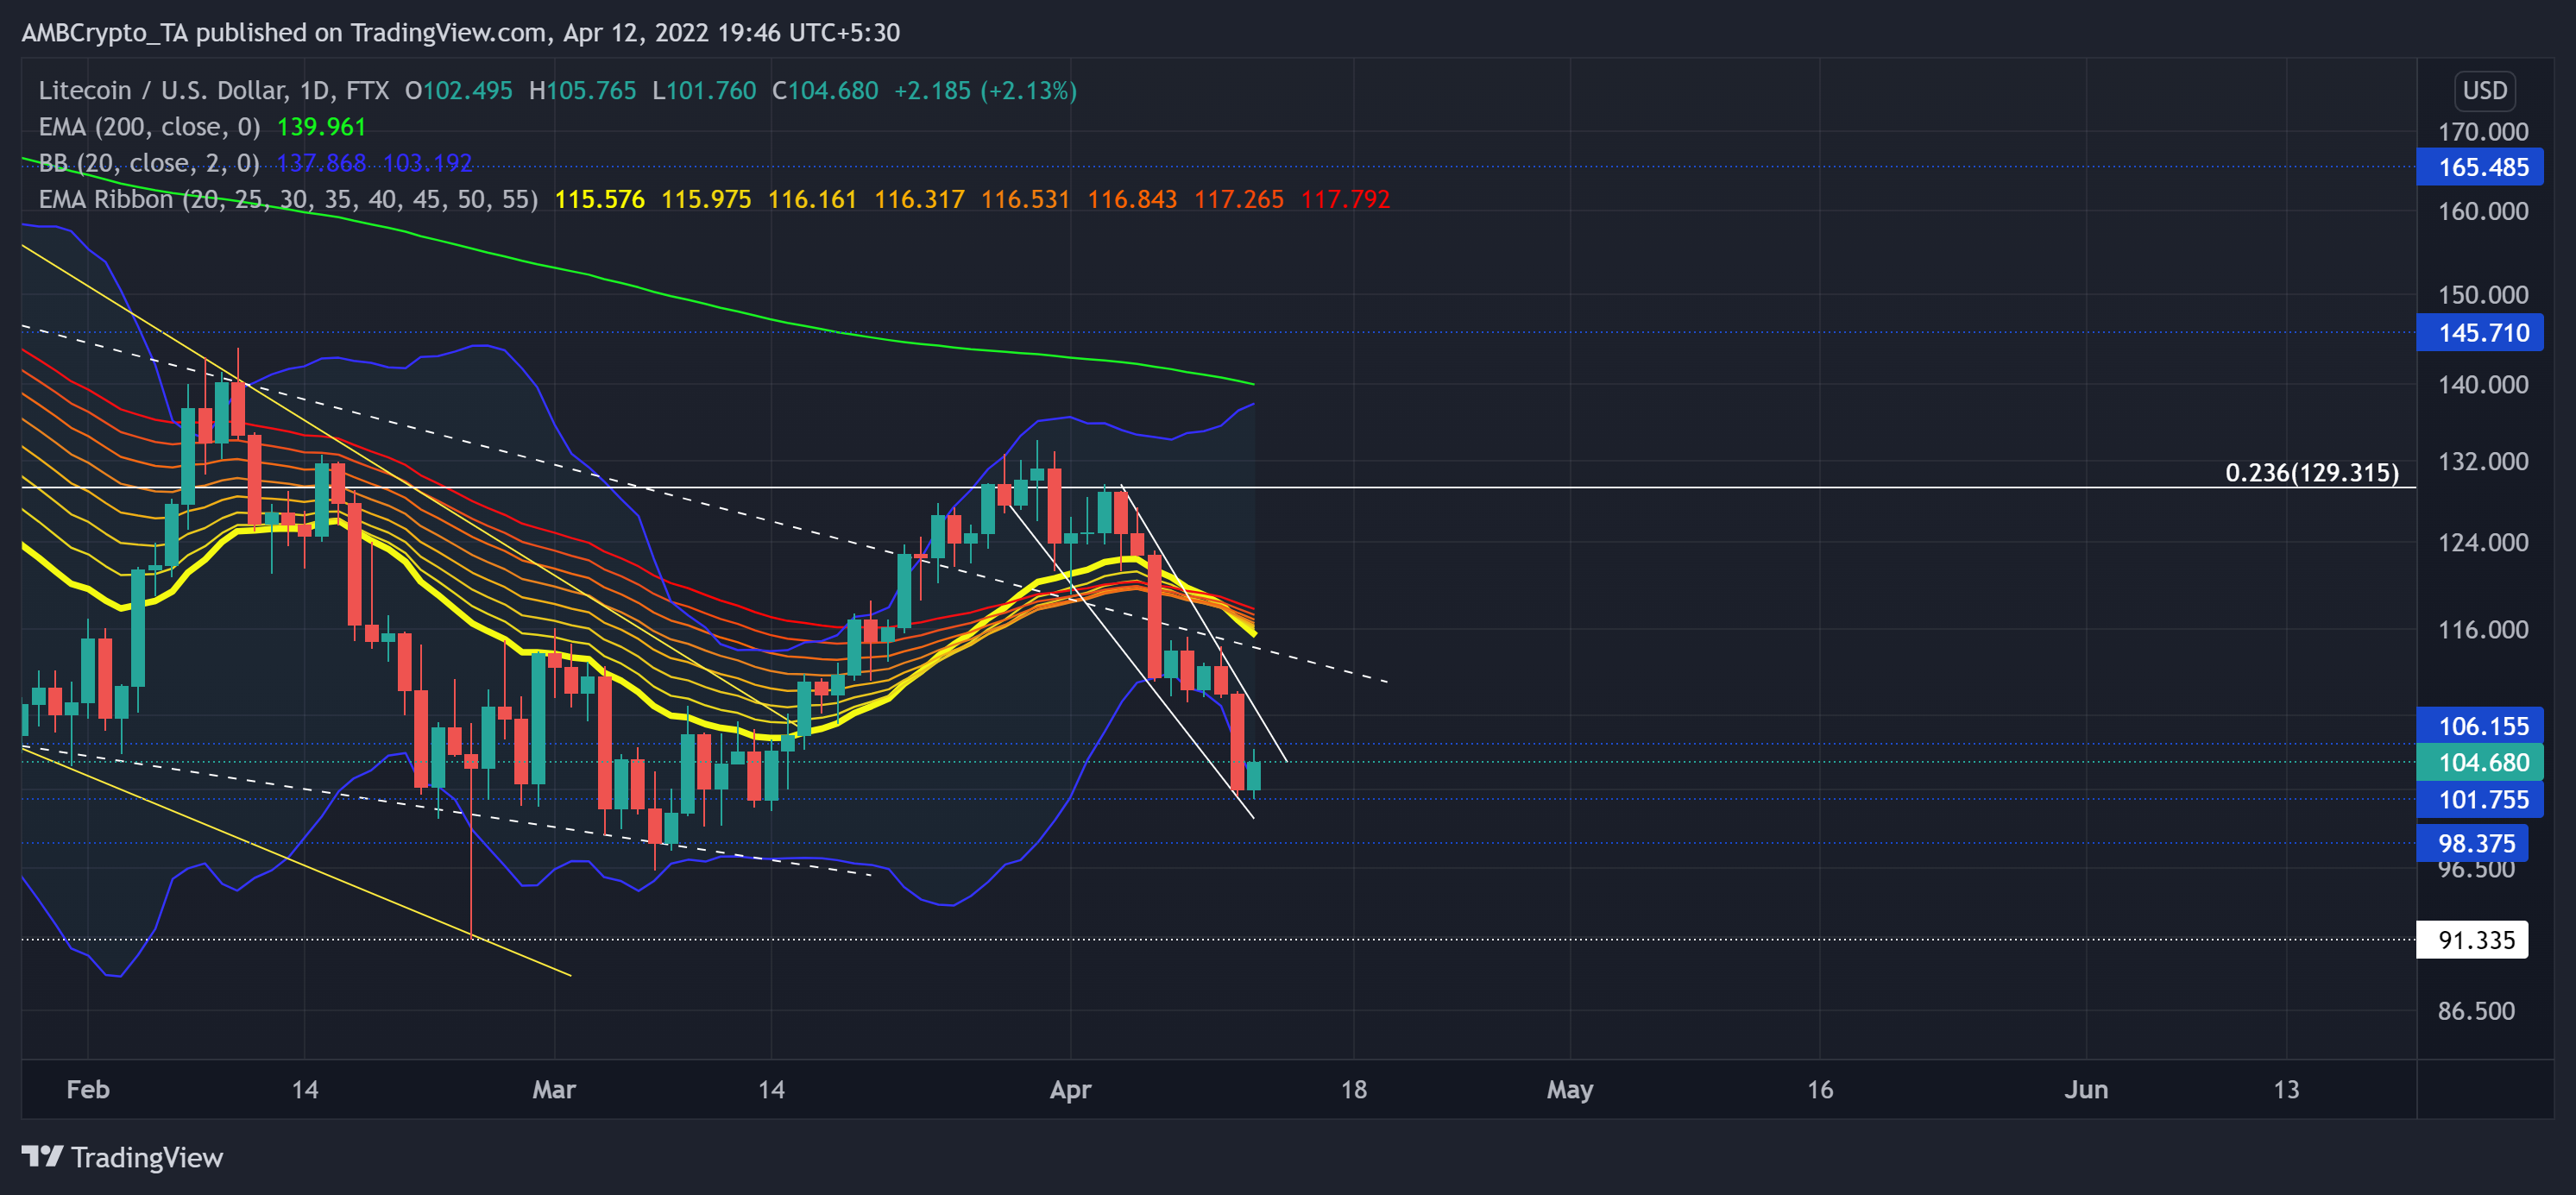
The buyers decisively guarded the 14-month-long support near $98. Hence, the altcoin registered an over 45.9% ROI from its yearly low on 24 February toward the 23.6% level. But following Bitcoin’s weekly double-digit fall, LTC dipped in a falling wedge (white) on its daily chart.
As a result, the EMA ribbons undertook a bearish flip after the sellers propelled high sell-offs and pushed the price toward the lower band of Bollinger Bands (BB). Also, while the 200 EMA (green) still looked south, the bears kept the long-term trend under their influence.
A potential break above the current reversal pattern would provoke a bullish revival toward the immediate trendline resistance (white, dashed). Then, considering the steepness of the near-term EMAs, LTC could continue a squeeze phase $114-$106 range.
Rationale
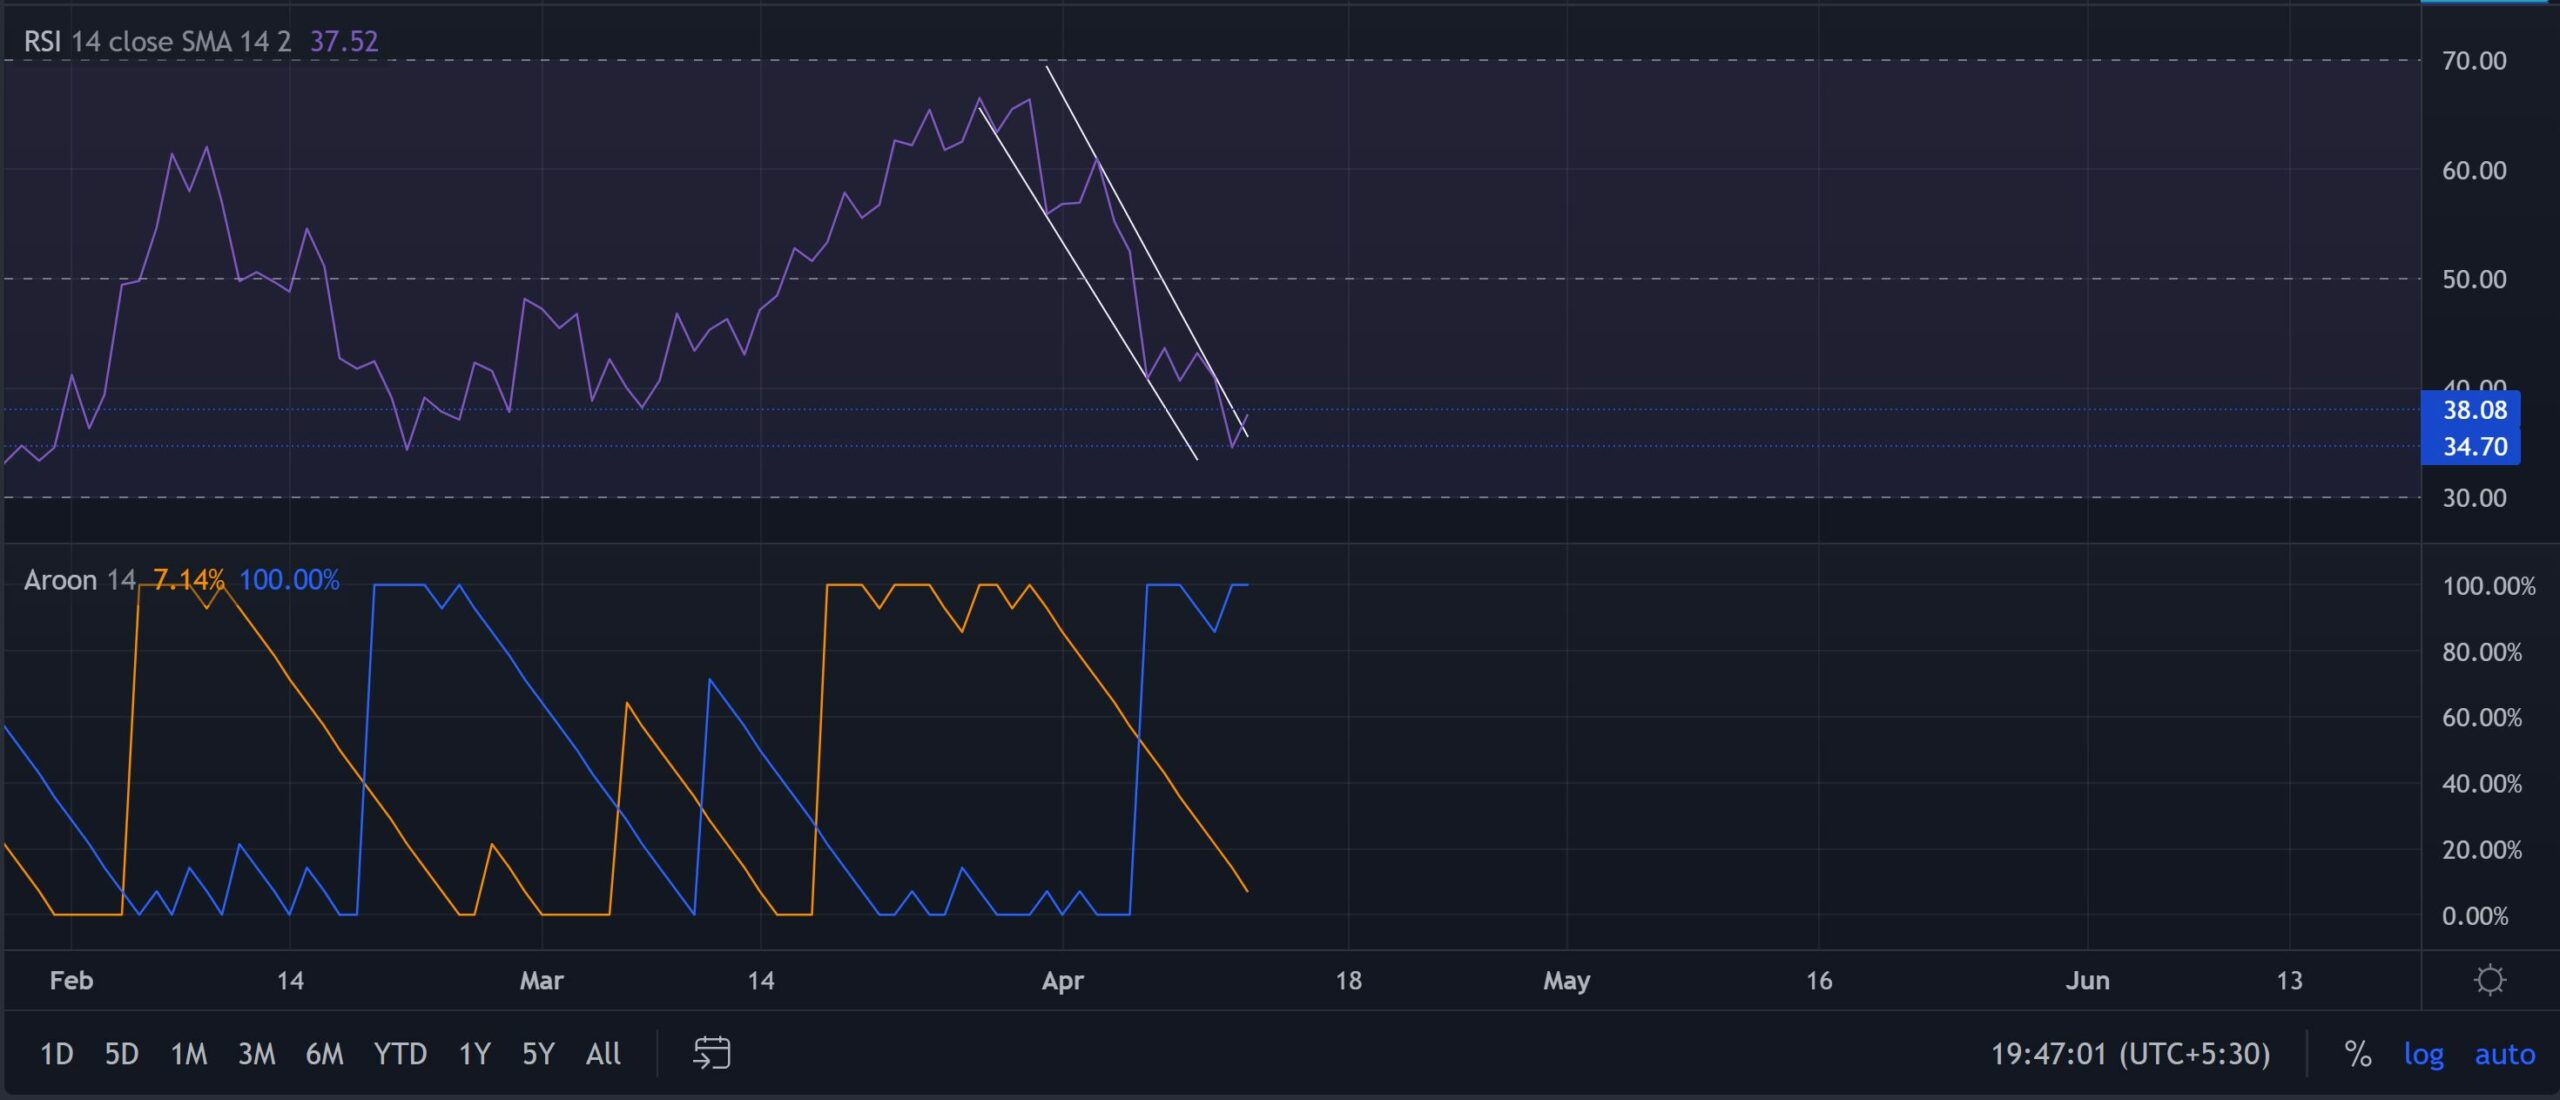
The RSI lost its momentum soon after the price hit the 23.6% Fibonacci ceiling. It depicted a seller’s market while falling into a down-channel. A compelling close above the 38-mark would hint at a near-term recovery on which the bulls can capitalize.
The acute polarity between the Aroon indicators keeps up the bullish revival hopes. While the Aroon up (yellow) approached the zero-mark, any revival from this level would favor the buyers.
Conclusion
As the price oscillated in the confines of a falling wedge while reaching near the lower band of BB, LTC had a tangible potential to test the $114-zone in the coming days. With the 20 EMA still looking south, the bears would then try to push the price below and initiate a tight phase.
Moreover, LTC shares a monstrous 93% 30-day correlation with the king coin. A close eye on Bitcoin’s movement would be imperative to make a profitable move.