- Despite high network activity, LTC was down by nearly 15% in the last 30 days.
- Most metrics and indicators hinted at a continued price decline.
Litecoin [LTC] has failed to earn investors profits as it continues to drop on the list of the top 30 cryptos. However, the coin did manage to excel on a particular front.
In fact, Litecoin outshone both Bitcoin [BTC] and Ethereum [ETH], which looked pretty optimistic for the blockchain’s future.
Litecoin surpasses Bitcoin, Ethereum
Litecoin recently posted a tweet pointing out an interesting development. As per the tweet, LTC continued to dominate BTC and ETH in terms of authentic active addresses.
This closely signified the rise in LTC’s adoption and high network usage over the past months.
In fact, AMBCrypto’s analysis of Santiment’s data also revealed a similar picture. Litecoin’s daily active addresses remained high throughout the last 30 days, as the number exceeded 858k on the 6th of June.
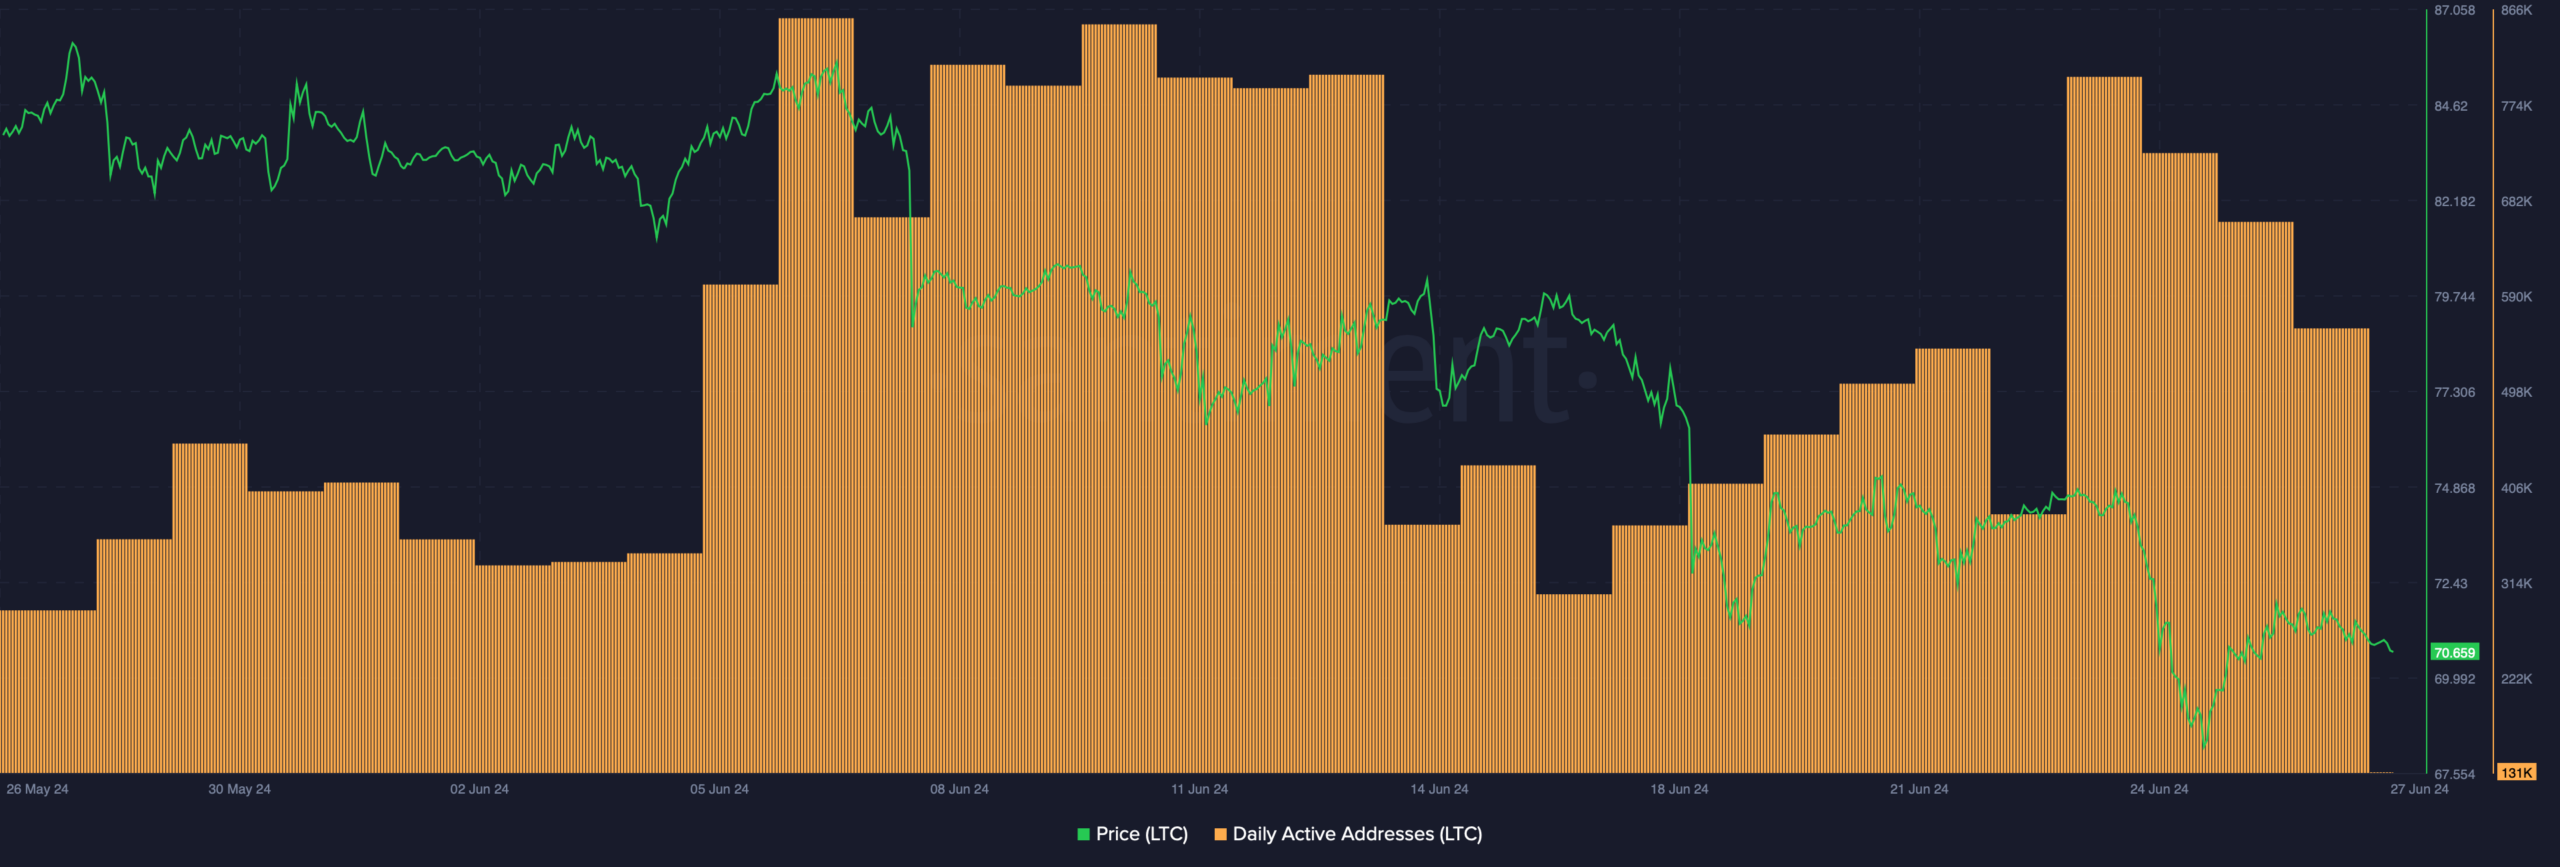
Source: Santiment
LTC bulls take the back seat
Though the blockchain’s network activity and usage were commendable, the same can’t be said for LTC’s price action. CoinMarketCap’s data revealed that LTC’s price dropped by nearly 15% in the last 30 days.
At the time of writing, LTC was trading at $70.61 with a market capitalization of more than $5.27 billion, making it the 22nd largest crypto.
Things for LTC can get worse in the coming days as a key metric hinted at a price correction.
AMBCrypto’s look at Glassnode’s data clearly revealed an increase in the coin’s NVT ratio. Usually, a rise in the metric hints that an asset is overvalued, increasing the chances of a price drop in the following days or weeks.
For the uninitiated, the NVT ratio is computed by dividing the market cap by the transferred on-chain volume, measured in USD.
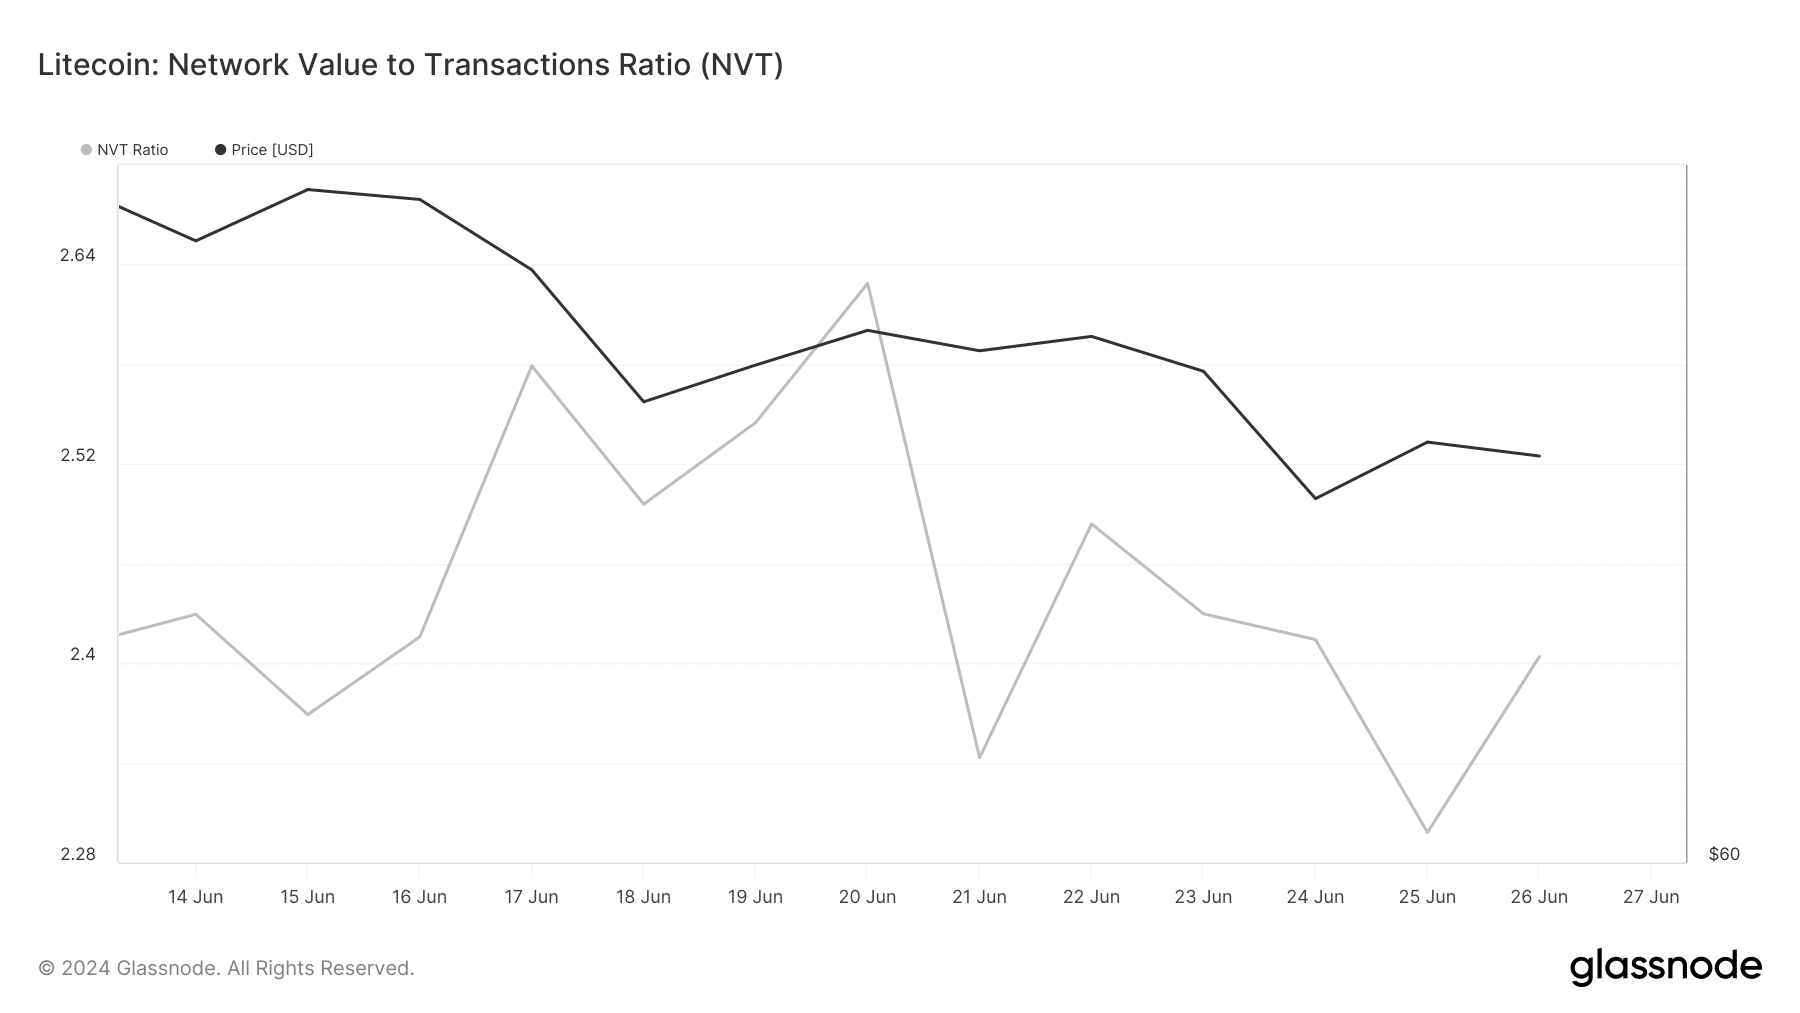
Source: Glassnode
To see whether the bears would continue to dominate, AMBCrypto then analyzed Litecoin’s daily chart. We found that most of the market indicators were in the sellers’ favor.
For instance, the MACD displayed a bearish advantage in the market. The Chaikin Money Flow (CMF) registered a downtick and was headed towards the neutral mark.
A similar declining trend was also seen on the Relative Strength Index’s (RSI) chart, hinting at a continued price drop.
Nonetheless, LTC’s price had touched the lower limit of the Bollinger Bands, hinting at a possible recovery soon.
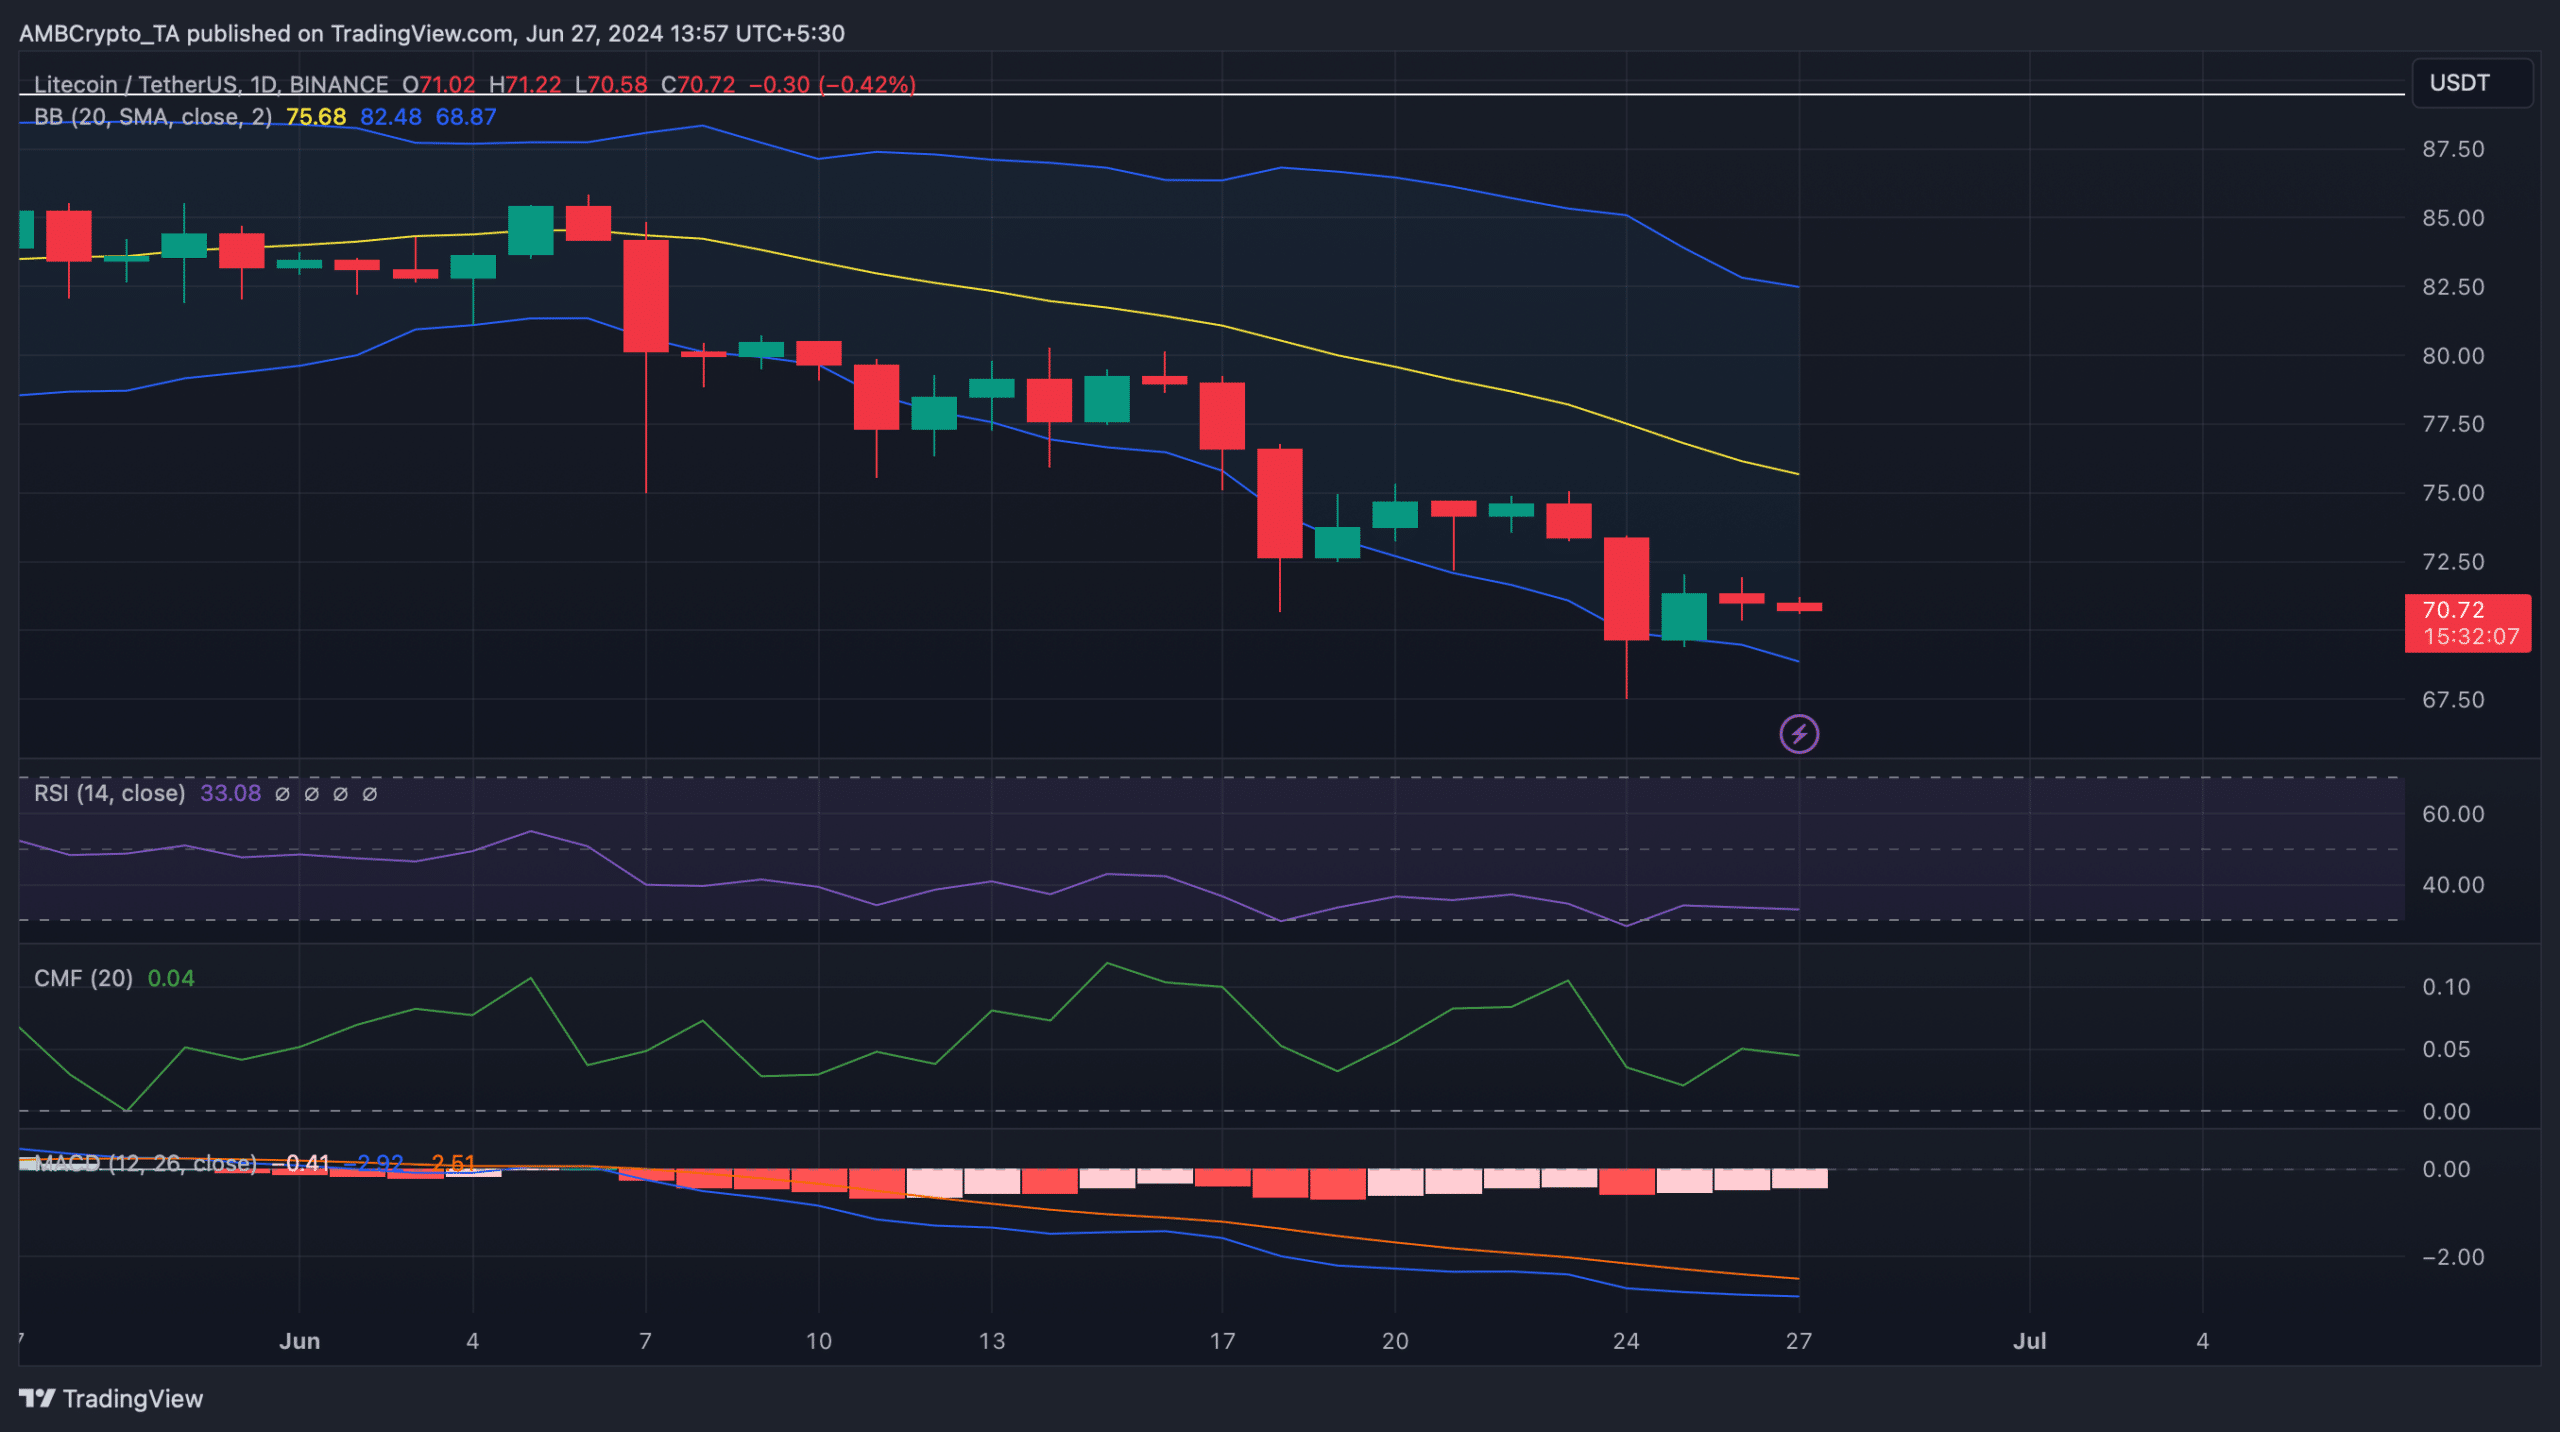
Source: TradingView
Realistic or not, here’s LTC’s market cap in BTC terms
Our analysis of Hyblock Capital’s data revealed that if the price decline continues, investors might witness LTC dropping to $67 in the coming days.
However, in the event of a trend reversal, LTC might first eye $81.4 in order to begin a full-fledged recovery.

Source: Hyblock Capital