Litecoin, Bitcoin Cash, Polkadot Price Analysis: 23 May

While Bitcoin traded between $36,000-$38,000, most alts adopted a wait and a watch strategy before making sharp moves. Large-cap alts such as Litecoin, Bitcoin Cash and Polkadot followed a similar pattern but held on to key support regions at the time of writing.
Litecoin [LTC]
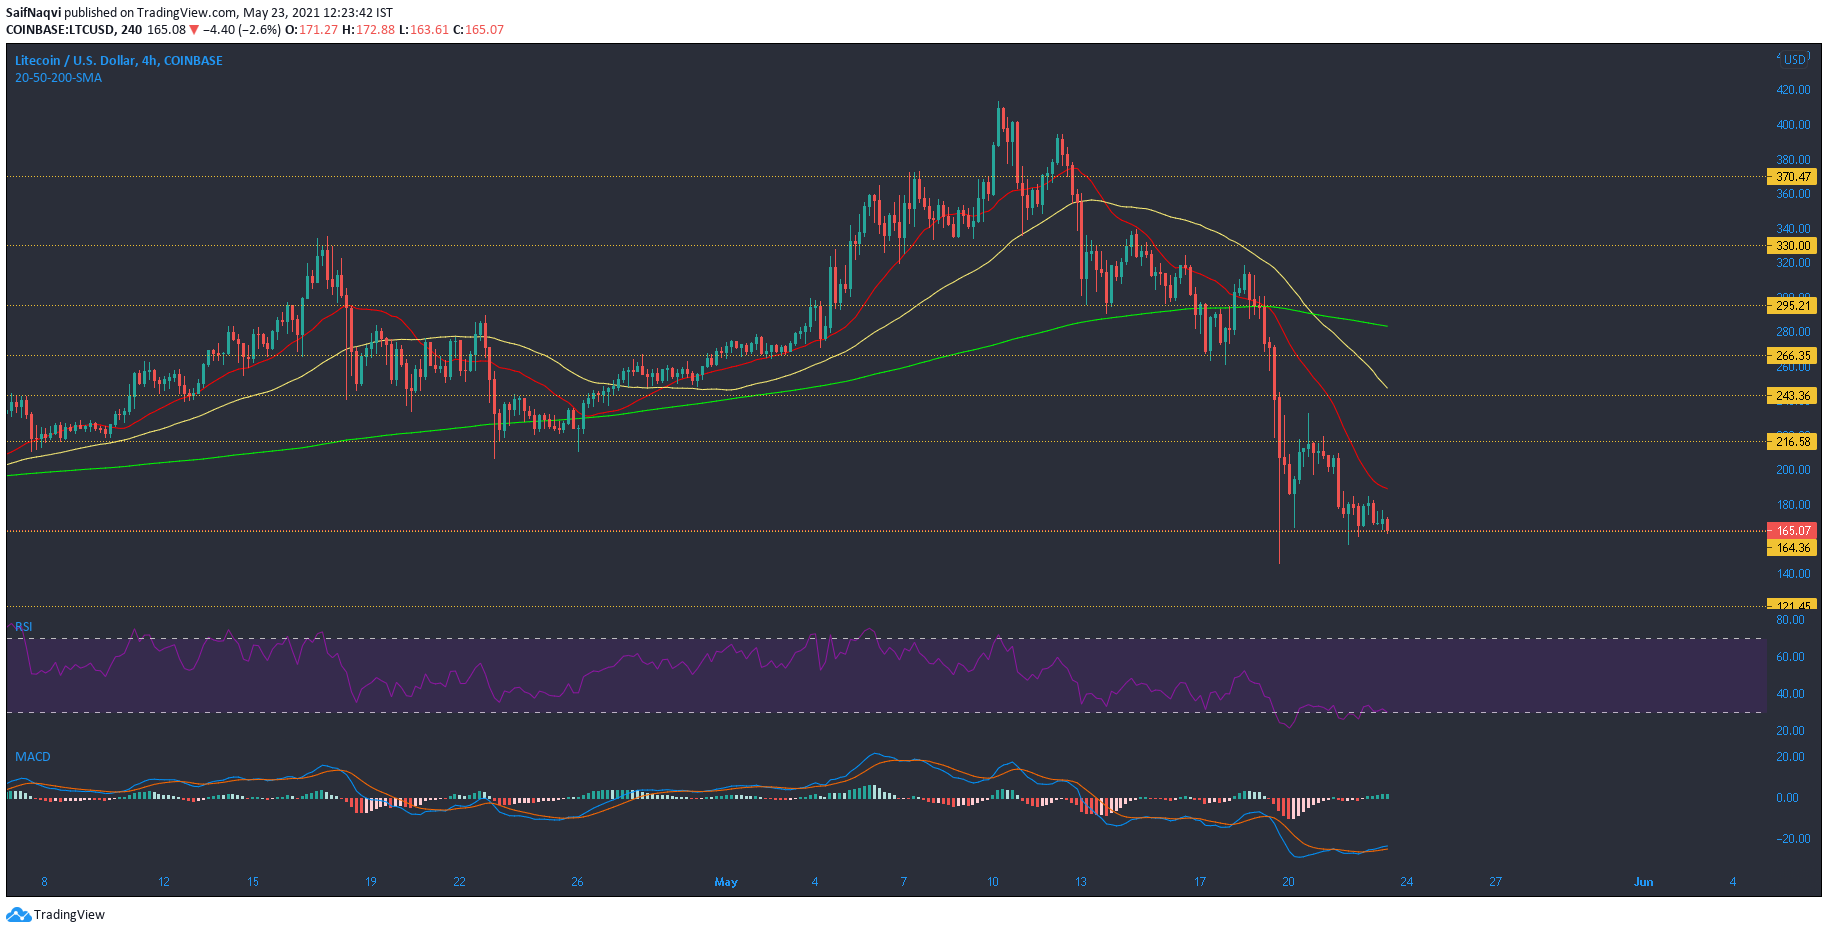
At the time of writing, Litecoin traded at $165, down by a marginal 0.4% compared to yesterday. Its movement on the 4-hour chart was held together by a strong support line at $163. Interestingly, this support was widely in focus during the broader market pullback in end-February. While buyers seemed to have found some relief at the current level, there was much uncertainty surrounding the short-term movement of BTC and ETH. Bearish signals from the market leaders could see LTC head towards the next line of defense at $121- a support region that was made prominent when LTC retraced by 35% in January.
RSI made steady lows and traded close to the oversold zone. Expect this index to remain below 40 over the coming sessions. A bullish crossover in MACD suggested that buyers could maintain $165 and avoid a further breakdown.
Bitcoin Cash [BCH]
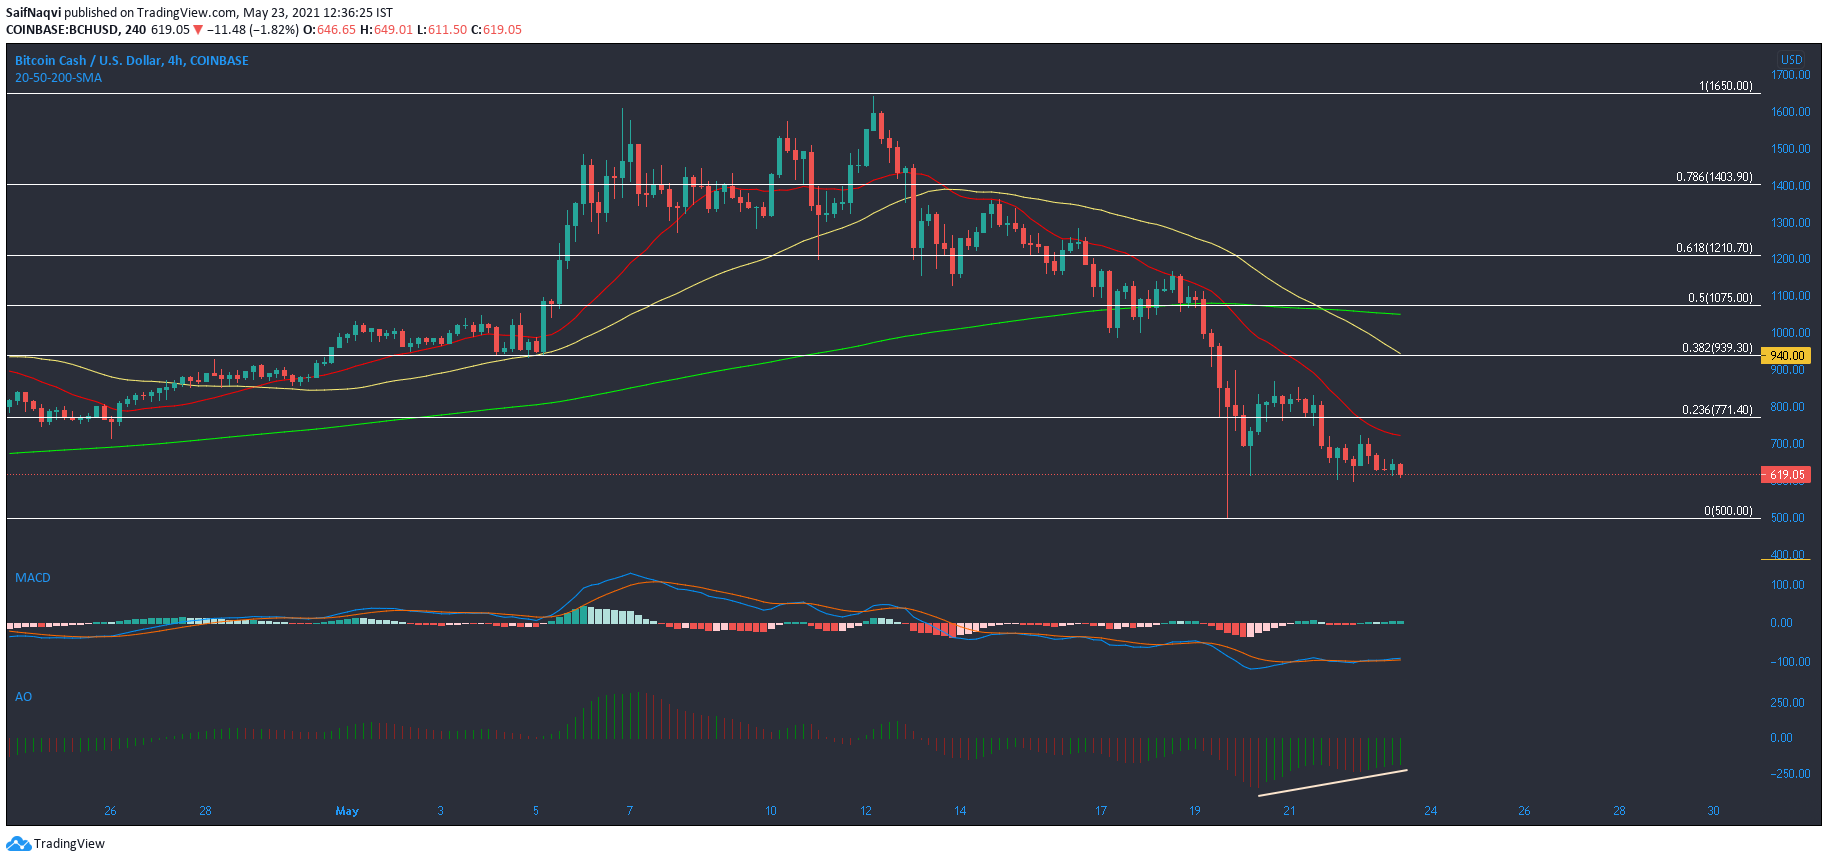
Over the last two weeks, Bitcoin Cash shed over 60% of its value, dropping from a high of $1,642 to its press time price of $619. While BCH held on to $600, there was some leeway till the next support mark at $500. Failing to defend $500 could see BCH move south towards its January lows of $370 which would result in an overall loss of 77% from its local top. Conversely, a retake of 38.2% ($939) and 50% ($1,075) Fibonacci levels could result in a favorable outcome.
A bullish twin peak setup on Awesome Oscillator highlighted the potential shift of momentum over to buyers but volumes were weak. MACD was less supportive of such an outcome and indicated some degree of equilibrium.
Polkadot [DOT]
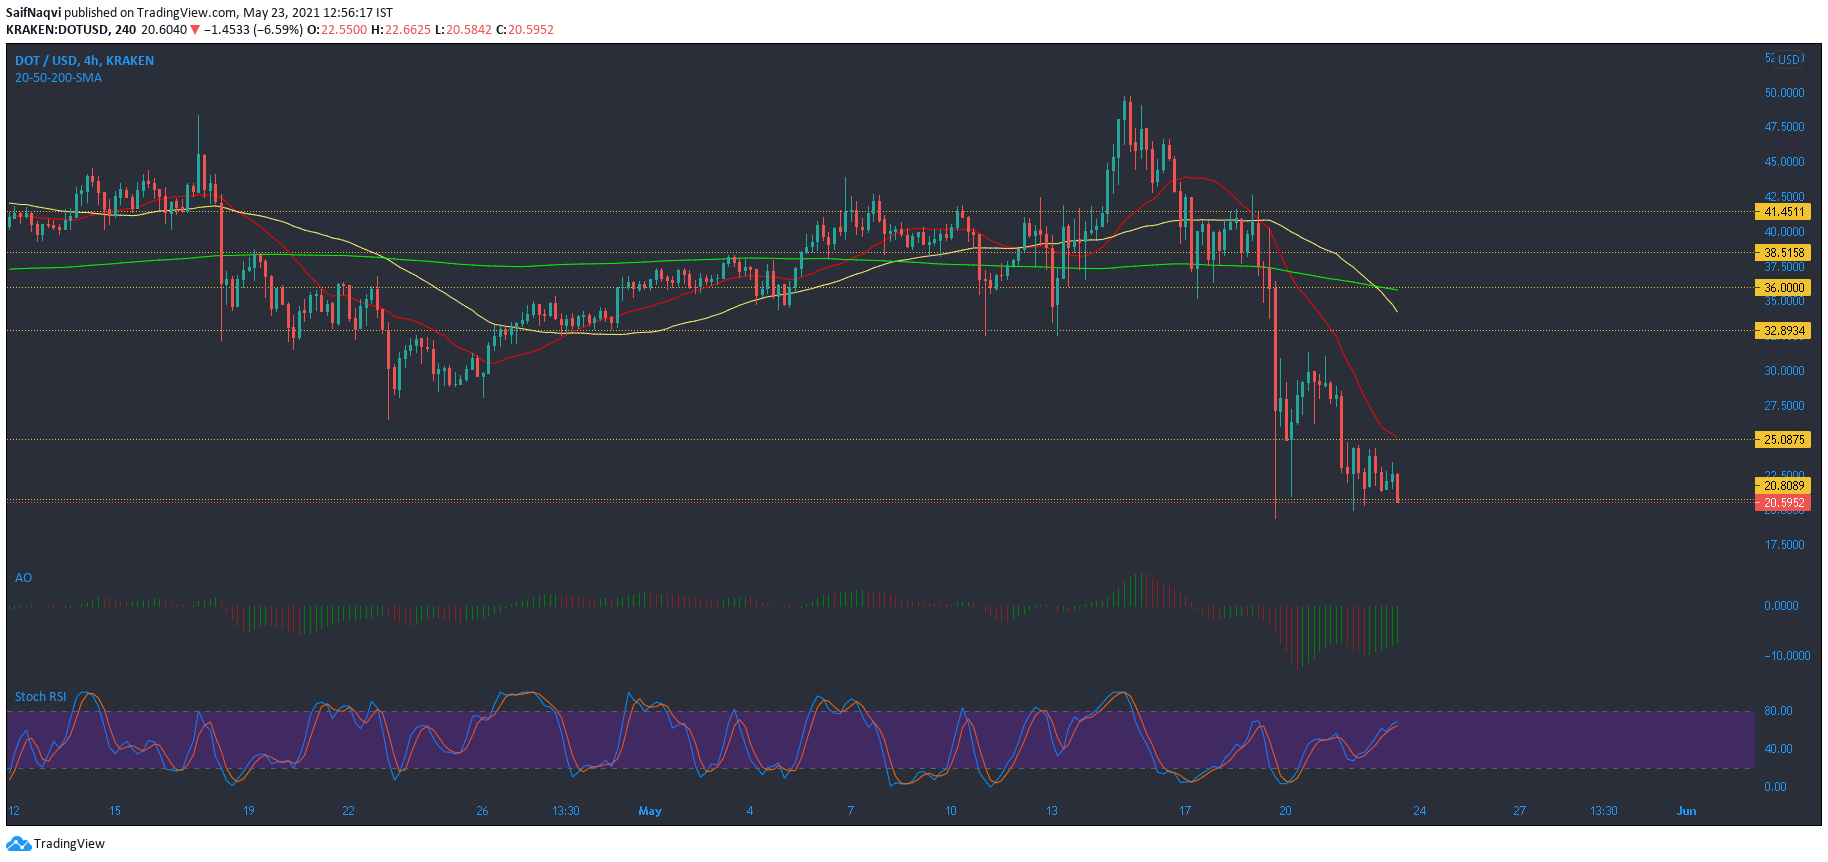
Polkadot’s downtrend was cushioned at $21.16 support but its movement over the coming sessions was of particular significance. If DOT is unable to break above $25 and its 20-SMA, selling pressure would likely return and result in a breakdown. This event could trigger another 33% drop towards $15. An extreme bearish outcome could even drag DOT to early January levels around $7. On the other hand, a breakout could result in a 20% price hike. Regaining the region above $36 and 200-SMA (green) would be more of a mid-term focus for bulls.
Similar to BCH, even DOT formed a bullish twin peak setup on Awesome Oscillator. Stochastic RSI was in bullish territory but this acted as a hedge against breakdown rather than a rise above $25


