Litecoin can target higher price levels if these factors play out

Once a regular top 10 crypto, Litecoin has slipped down the rankings since the 19 May broader market crash. The dearth of retail and institutional interest also hurt its price progression as participants chased after better performing alts.
A brief period in early-September helped rekindle some sparks in the market, but sellers have taken over since. LTC was now within the confines of a down-channel and awaited a strong support level to kickstart a recovery. However, thwarting out sellers was not an easy task and LTC had a mountain to climb before turning more heads.
LTC 4-hour Chart
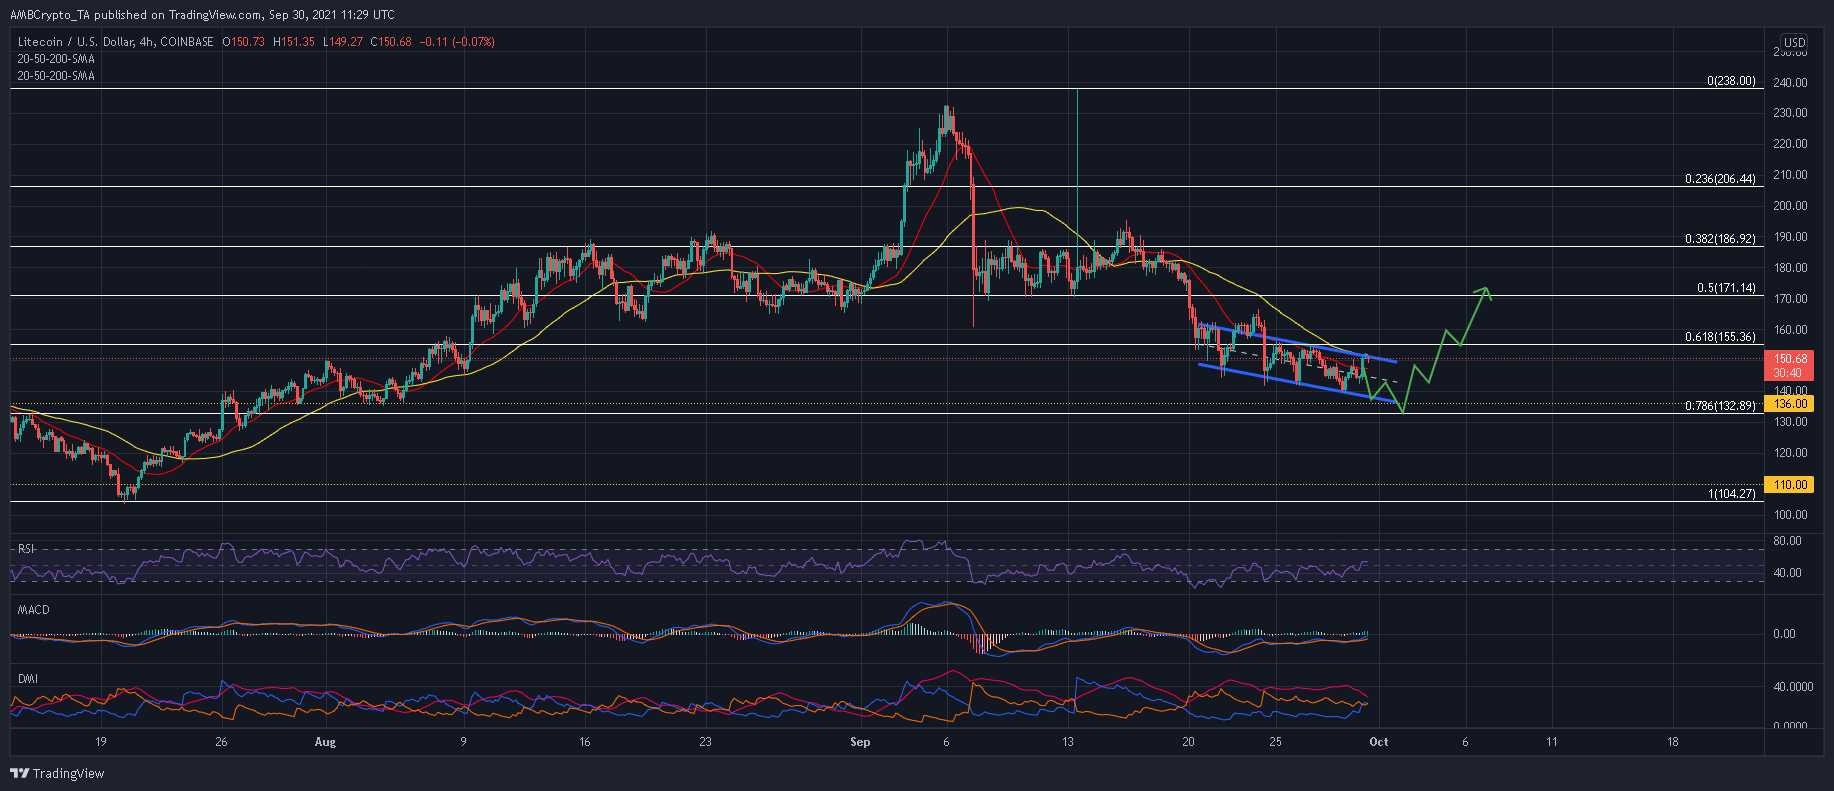
Litecoin began on a positive note during September. Speculations surrounding Walmart’s adoption of LTC as legal tender sparked a 45% run up to a near 4-month high at $232.6. As Walmart quashed these rumors, an immediate 20% sell-off was observed after which LTC sliced below an important support line of $163.4.
Since then, LTC formed lower highs and lows and took shape within a down-channel. Now, even though LTC tested the upper trendline, weak market conditions did not bode well for an upwards breakout. A bearish crossover between the 50 and 20 SMA’s on 19 September was expected to deny bulls from capitalizing on any near-term opportunities.
Instead, expect bears to maintain LTC within the pattern by targeting a newer low close to $136. A bullish response was anticipated at the 78.6% Fibonacci level but LTC would need to push above $155.3 to invite more participants. A few of LTC’s indicators suggested that bulls had already laid the foundation for such a move.
If an early breakout is not observed, LTC risked another 30% decline to its demand zone of $104-$110. This was also LTC’s fail-safe if the market played out in favor of the bears.
Reasoning
Bullish divergences were spotted across the RSI and MACD. Higher peaks indicated that bulls were making progress as selling pressure eased. This made the region between $136 and the 78.6% Fibonacci level more attractive in terms of an upwards breakout. However, the Chaikin Money Flow’s trajectory would keep buyers in check.
Conclusion
LTC was expected to make a downwards run to the 78.6% Fibonacci level before breaking north from its pattern. This would allow bulls to climb back above to the 50% Fibonacci level, from where additional price ceilings can be targeted. An early breakout above the 50-SMA (yellow) would also present a similar outcome. Meanwhile, traders can go long once LTC shows signs of a reversal between $133-$136.