Litecoin, Cosmos, Stellar Lumens Price Analysis: 21 April

As of today, Litecoin had a bullish outlook on its price action, and the $115 area was a strong zone of resistance that LTC could break past soon. Cosmos and Stellar Lumens, on the other hand, appeared to form a range.
Litecoin (LTC)
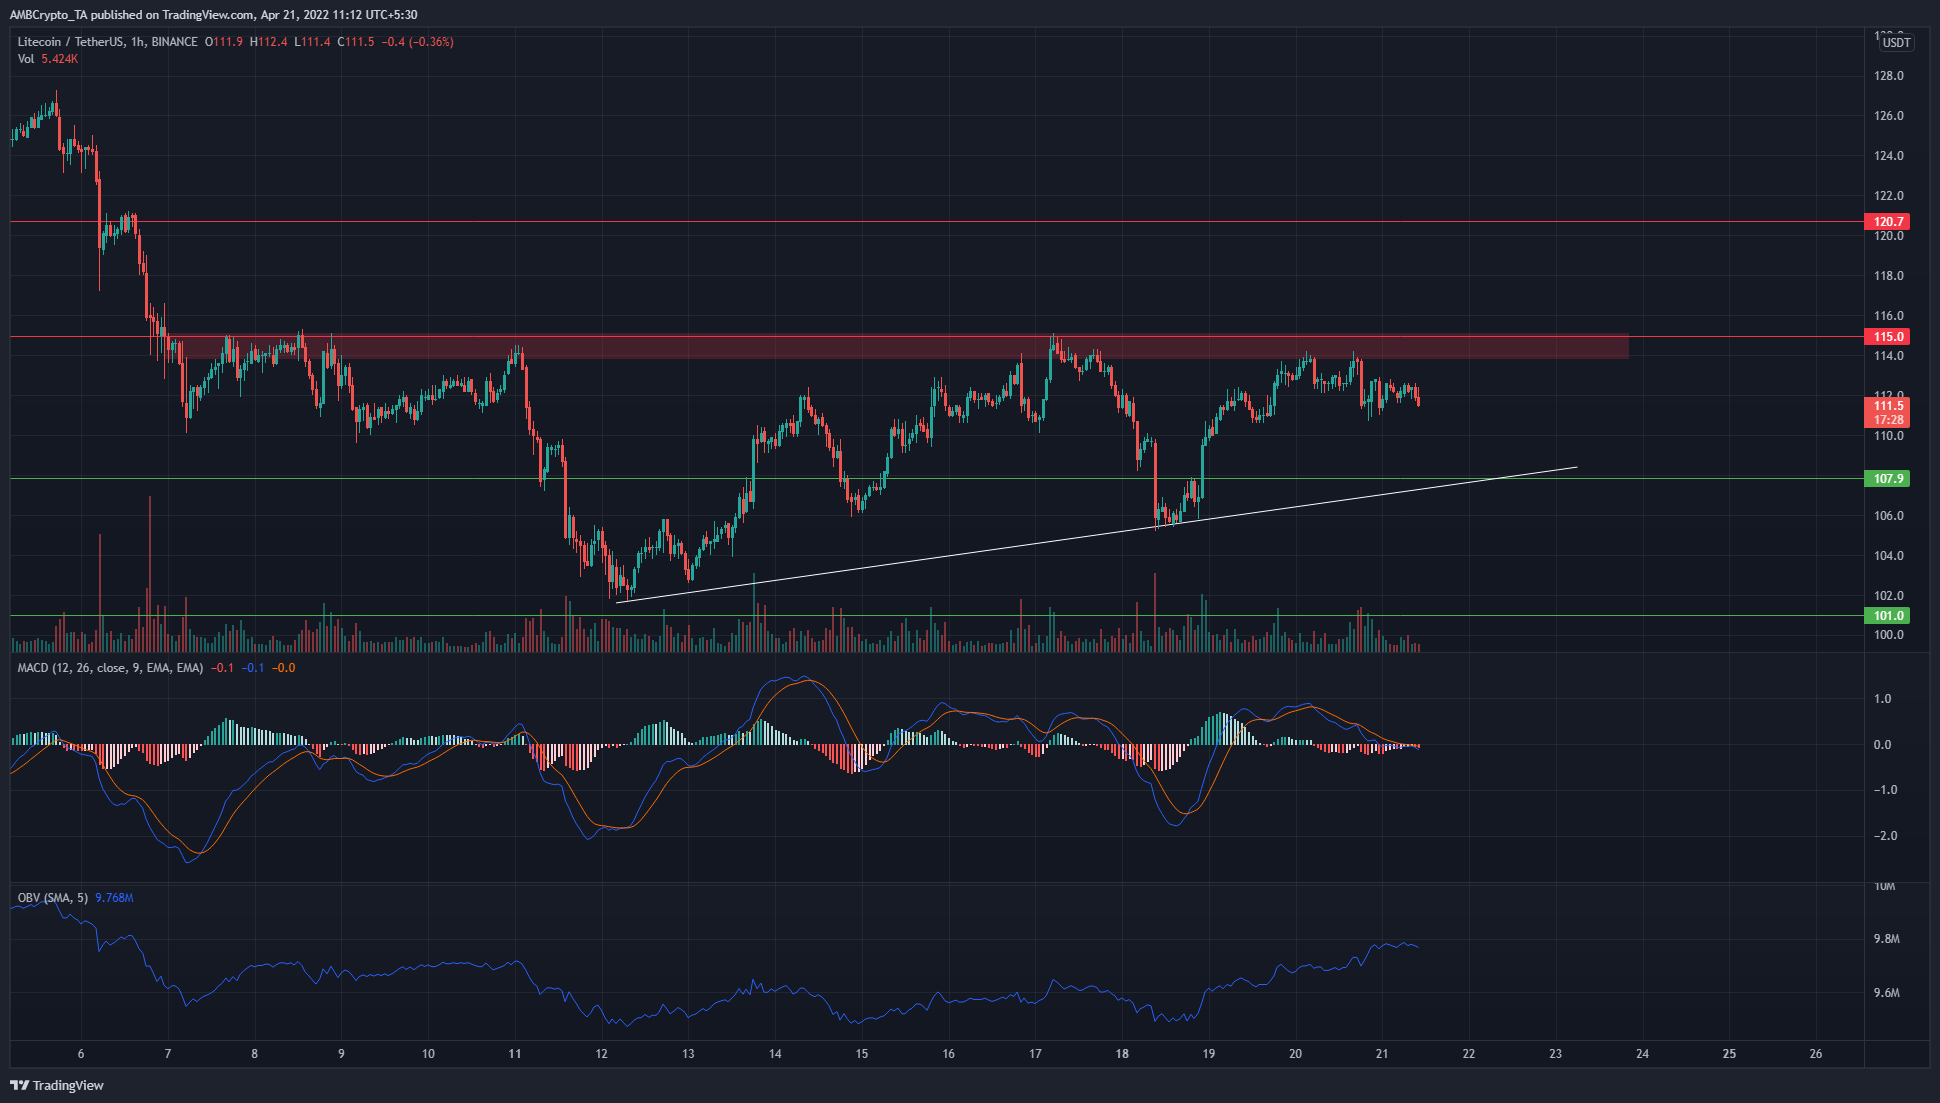
Litecoin faces stiff resistance in the $115 area (red box). In the near term, it has strong support levels at $101 and $107. The ascending trendline support (white) meant that the price was forming something like an ascending triangle pattern.
Hence, over the next few days, it is likely that LTC has a bullish outlook. It could see a pullback to $110, and also to the support level at $107.9.
The MACD pulled back from strongly bullish to the zero line, to show neutral momentum at the time of writing. The OBV has seen an uptick in the past week, to show the presence of buying volume.
Cosmos (ATOM)
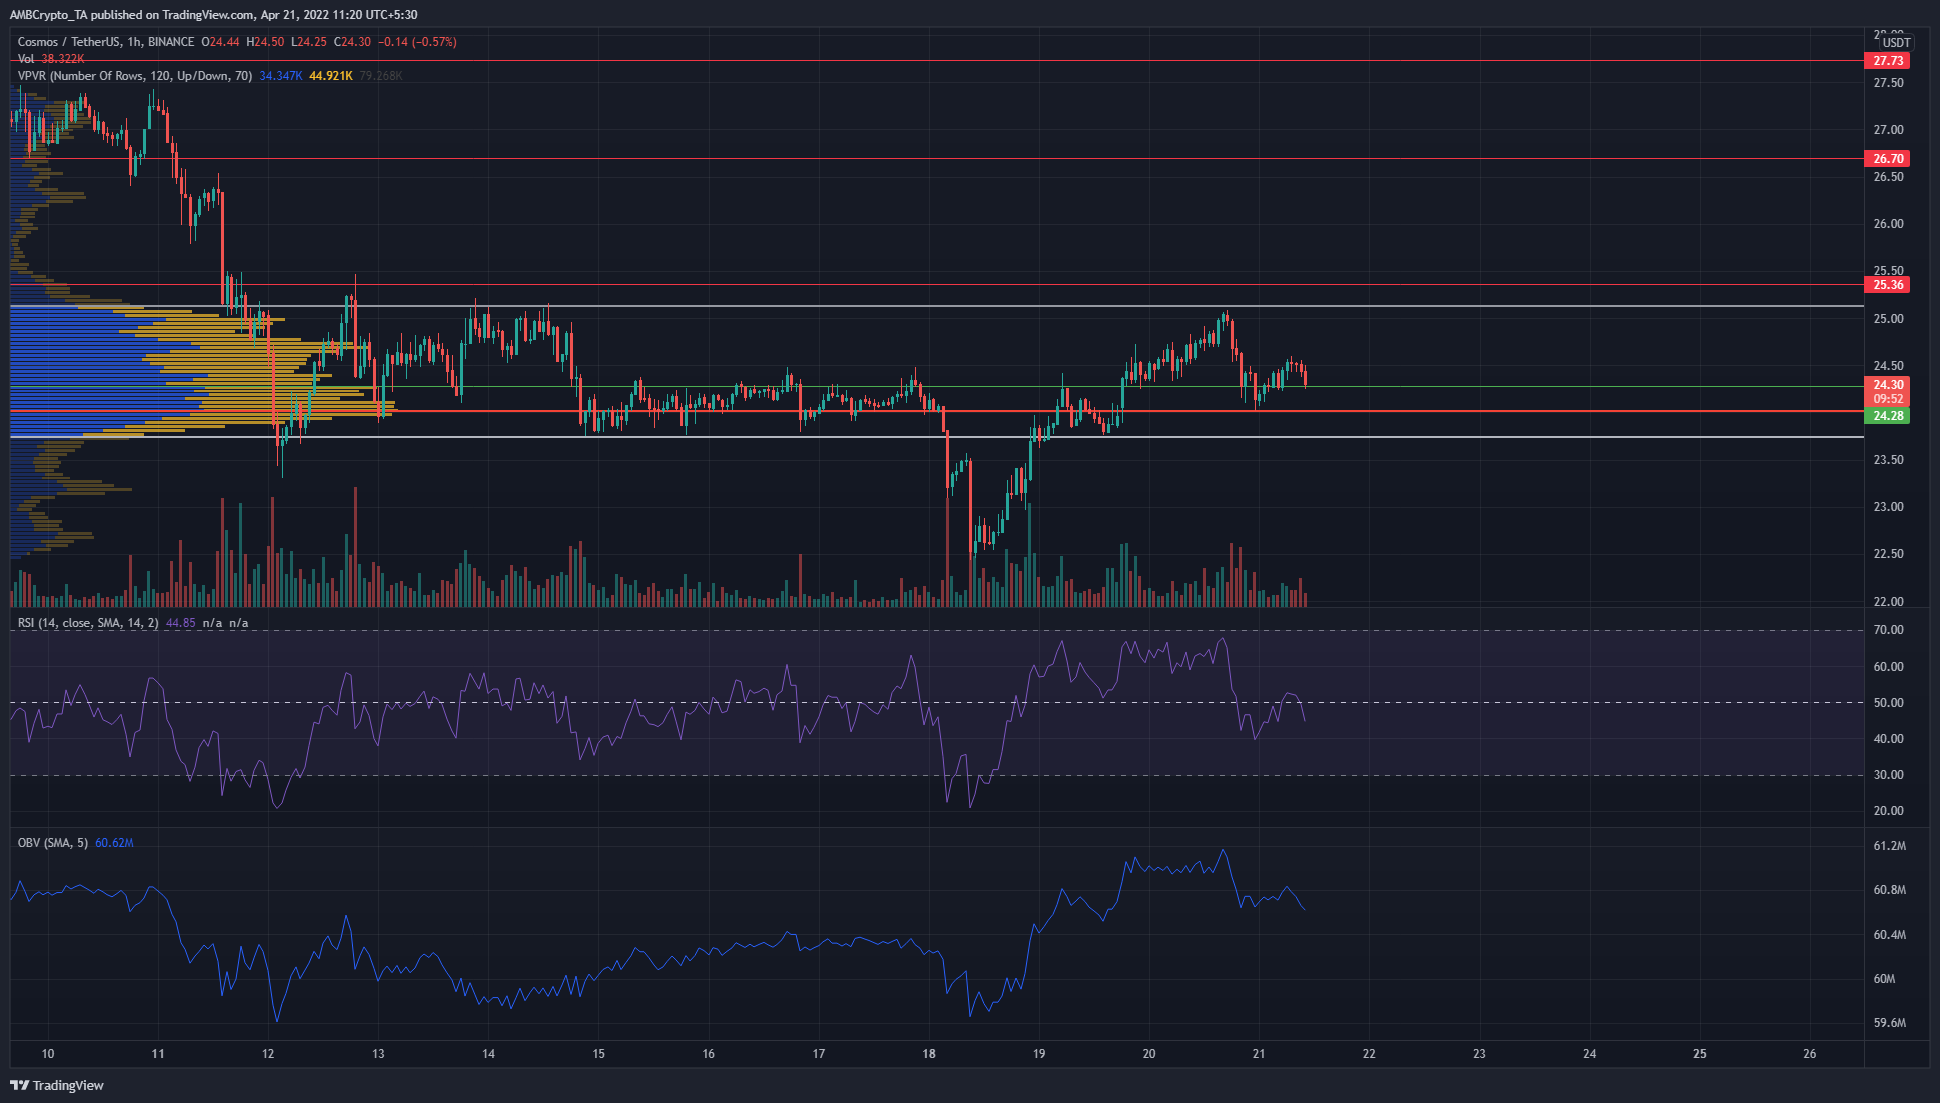
The Volume Profile Visible Range showed the Point of Contol at $24.04, and the Value Area Lows and Highs lie at $23.82 and $25.05, This meant that, over the past week, the majority of trading has occurred between these levels.
At press time, the RSI fell beneath the neutral 50 line and the price was at the $24.28 support level. This suggested that ATOM could see a further dip. The OBV has also dipped on the pullback from $25, but overall it still showed more buying volume than selling recently.
The $24-$24.3 area could offer a buying opportunity in the next few hours.
Stellar Lumens (XLM)
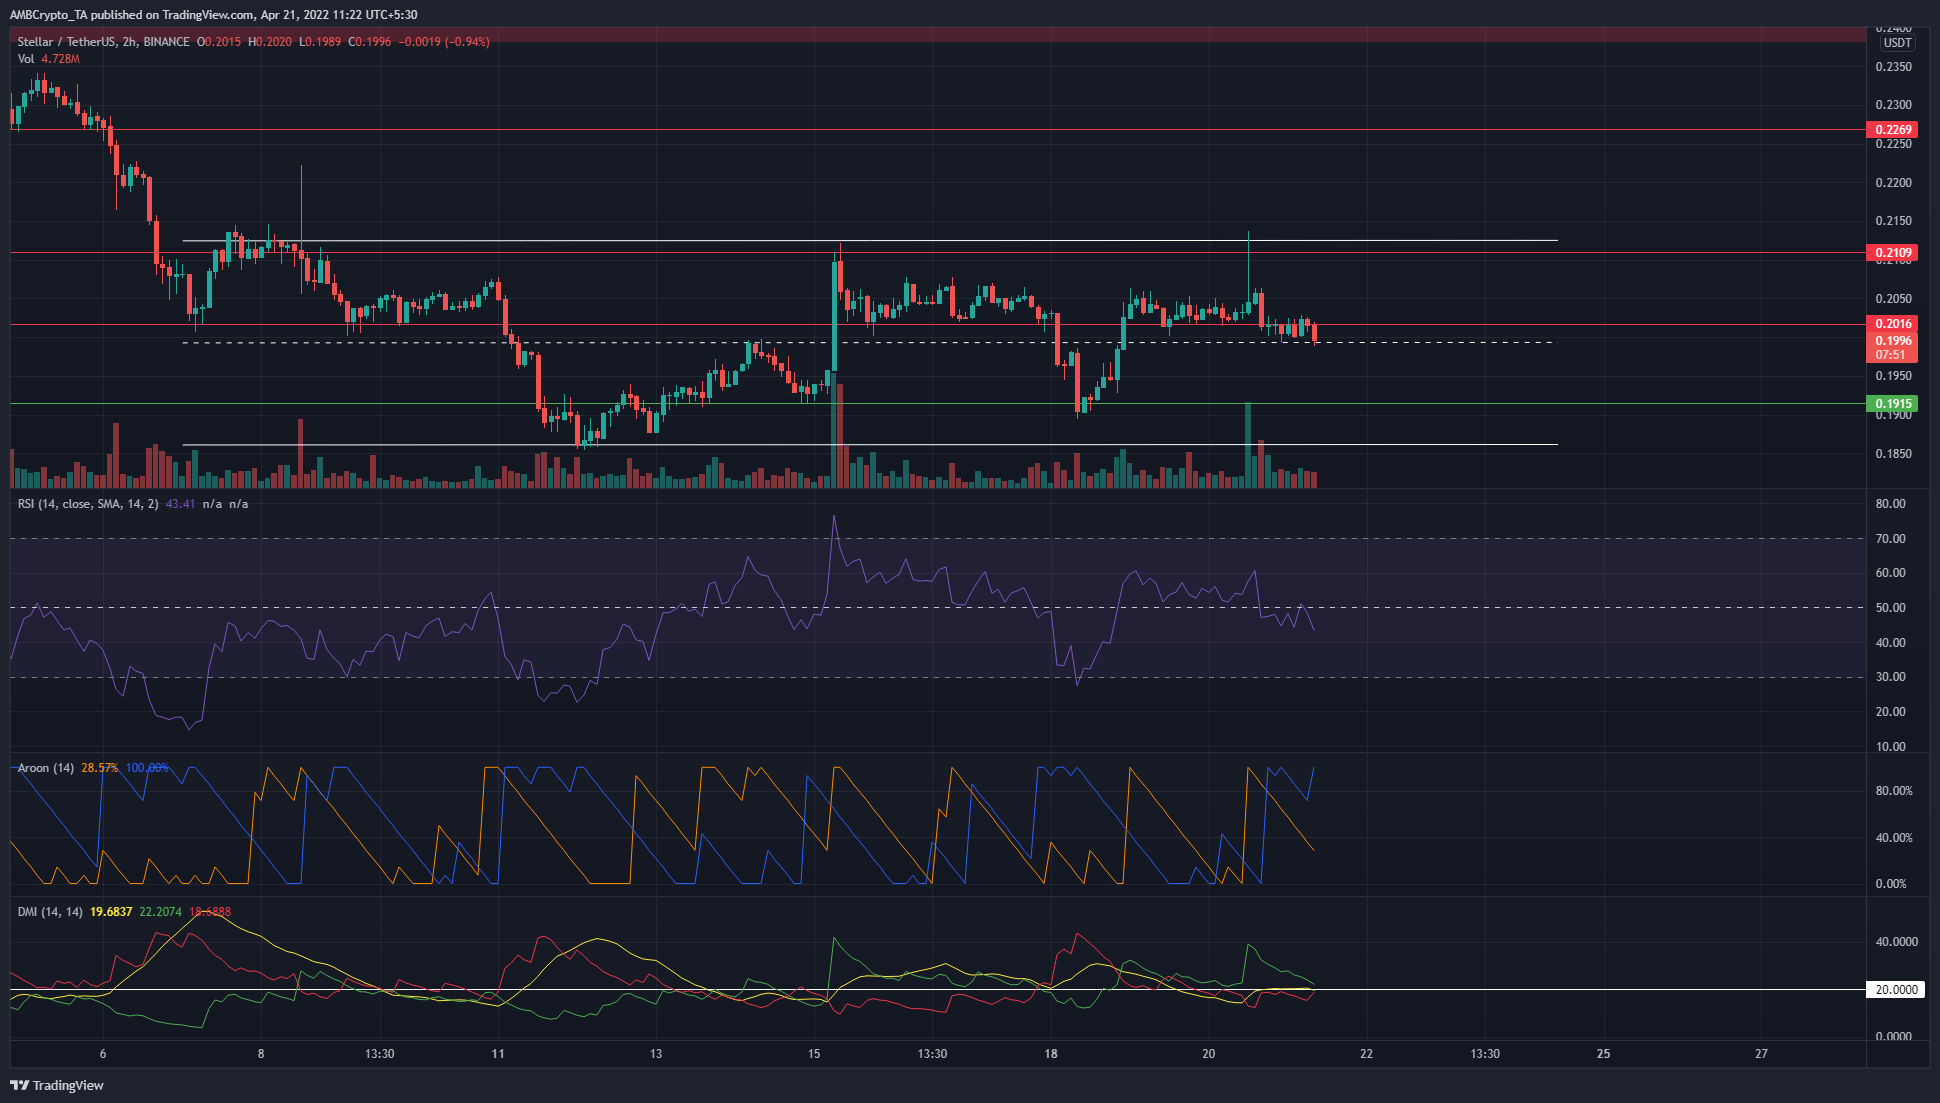
On the 2-hour chart, XLM appeared to form a range from $0.2125 to $0.186 (white). In the past two weeks, the RSI has climbed to 70 as well as dipped to 30. The RSI did not show a steady trend in either direction, and the price was also oscillating between the $0.21 and $0.18 levels.
The Aroon Oscillator also showed up and downtrends over the past two weeks, while the DMI also showed no strong trend in progress. The ADX dipped below the 20 mark in the past couple of days, to show the lack of a strong trend in progress.