Litecoin could see these levels before continuing its current rally
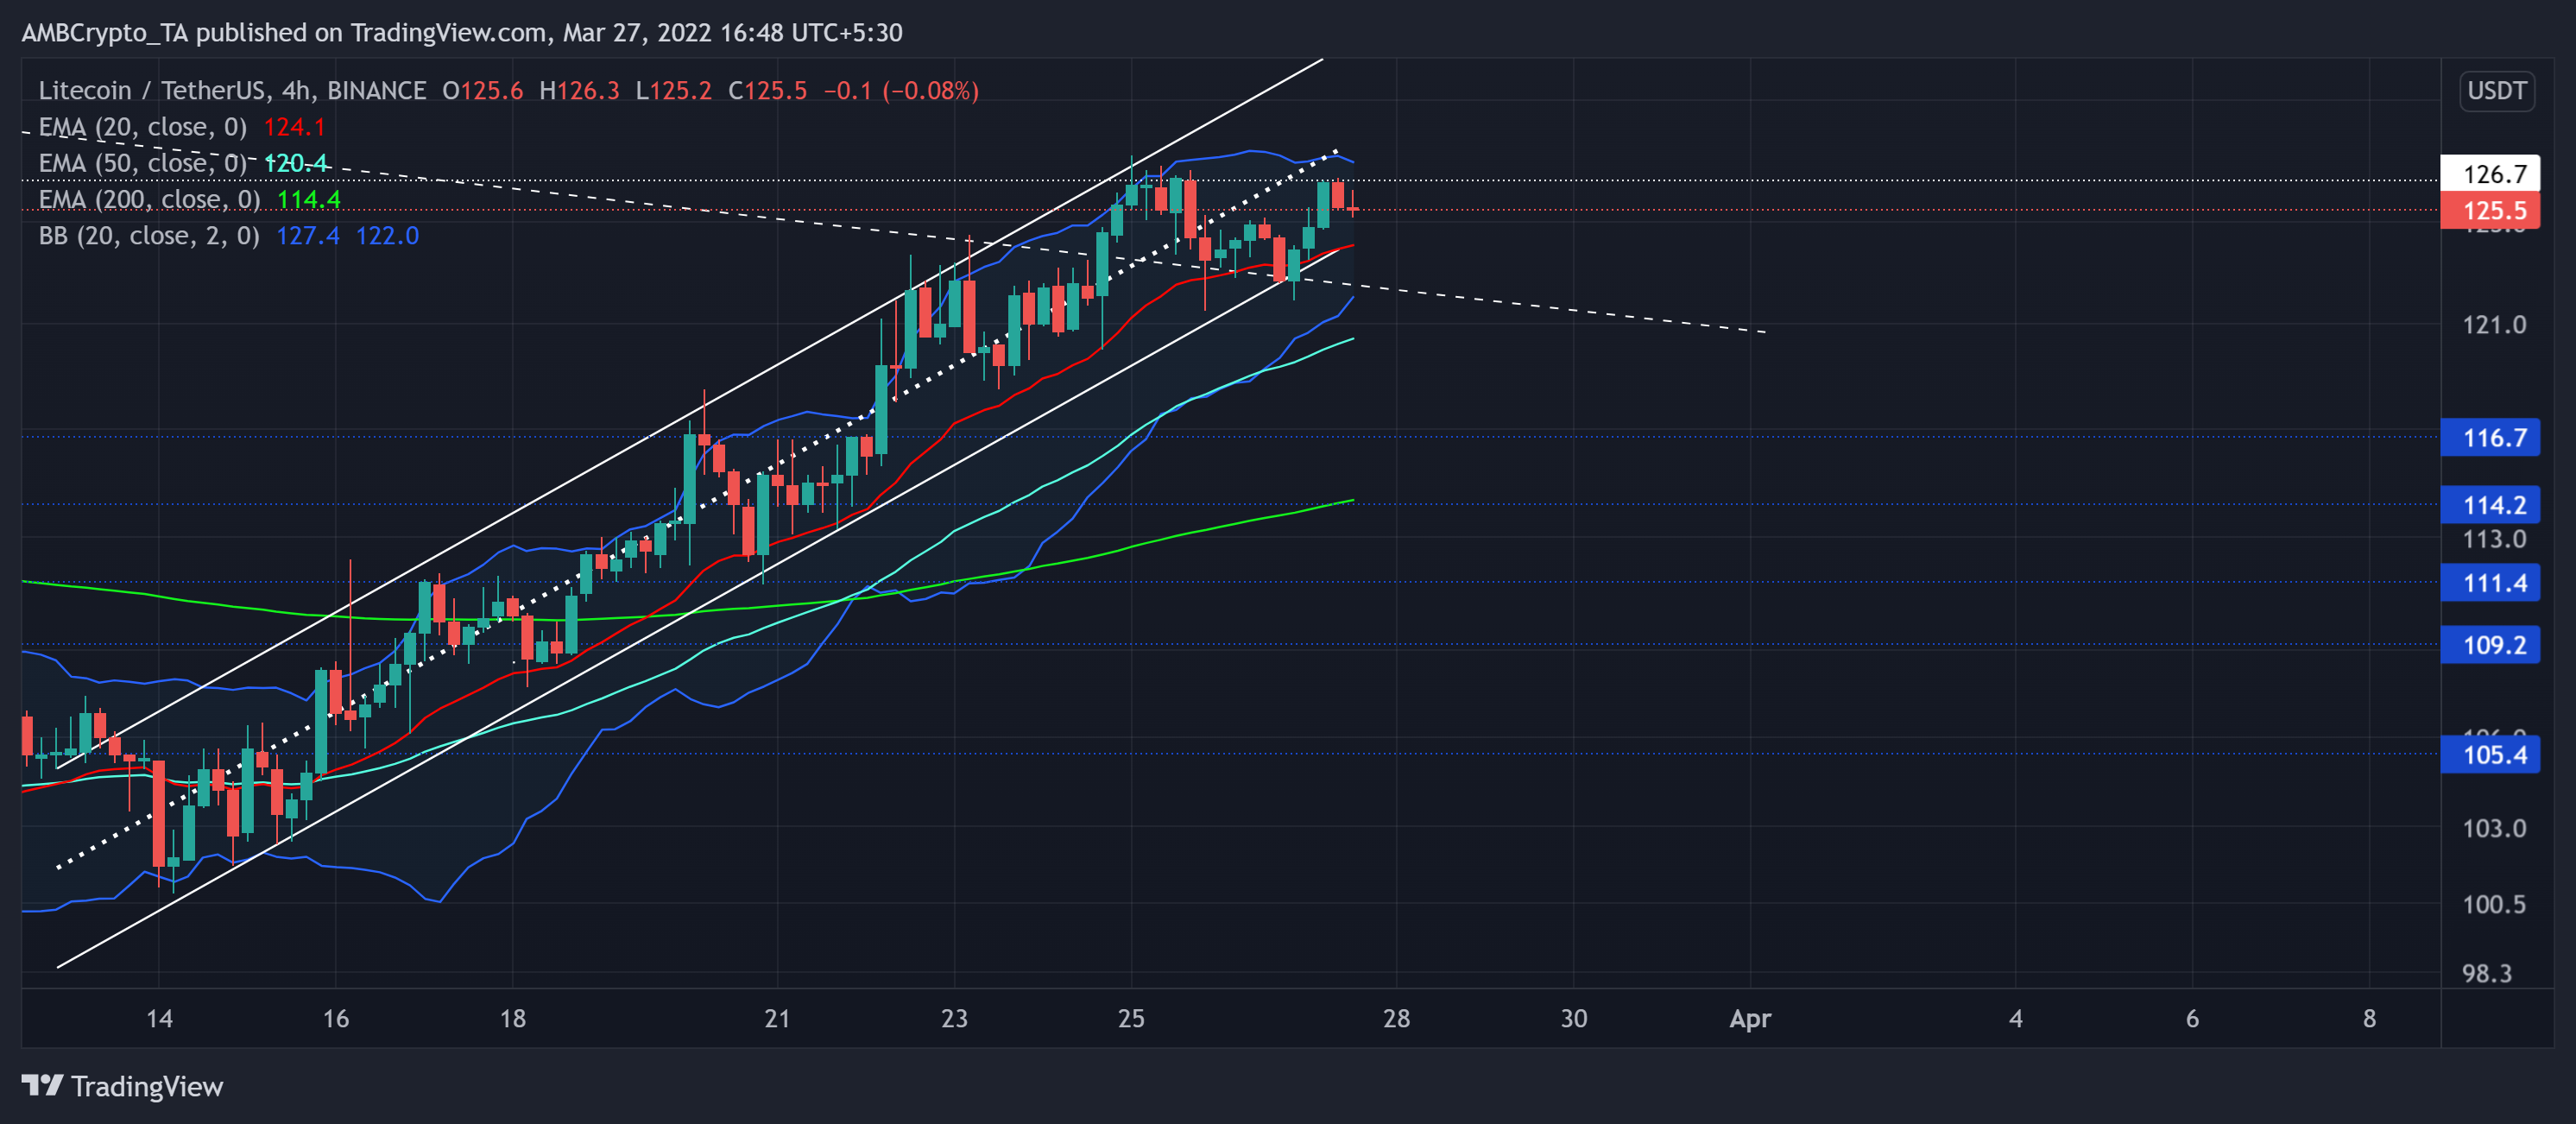
With the commencement of its recent bullish rally, Litecoin (LTC) finally traded above the 20/50/200 EMA while rising within an ascending channel (white). Meanwhile, the bulls kept testing the $126-resistance.
A sustained close below the $126-mark could propel the alt to retest the $122-$123 zone before the bulls continue their buying spree. Any close below its 20 EMA (red) would lead to a patterned breakdown towards the $120-mark that coincided with its immediate trendline support (white, dashed). At press time, LTC traded at $125.5.
LTC 4-hour Chart
After the alt plummeted towards its 14-month low on 24 February, the bulls finally stepped in to defend the $90-base. As a result, LTC registered an over 39.52% ROI over the past month. LTC bulls quickly took advantage of the overall perception and flipped the three-month trendline resistance to support.
As it recovered its previous sell-off loss, it found a comfortable close above its near and long-term EMAs. Also, the gap between the lower and upper band of the Bollinger Bands (BB) is decreasing. This reading entailed a continued tight phase in the near term.
While the bears ensure the $126-ceiling, a potential retest of the lower trendline of the up-channel seemed likely. Following this, the bulls would be keen on keeping their edge intact and try to topple the $126-mark. Any fall below the pattern could find testing grounds near the lower band of BB and its trendline support.
Rationale
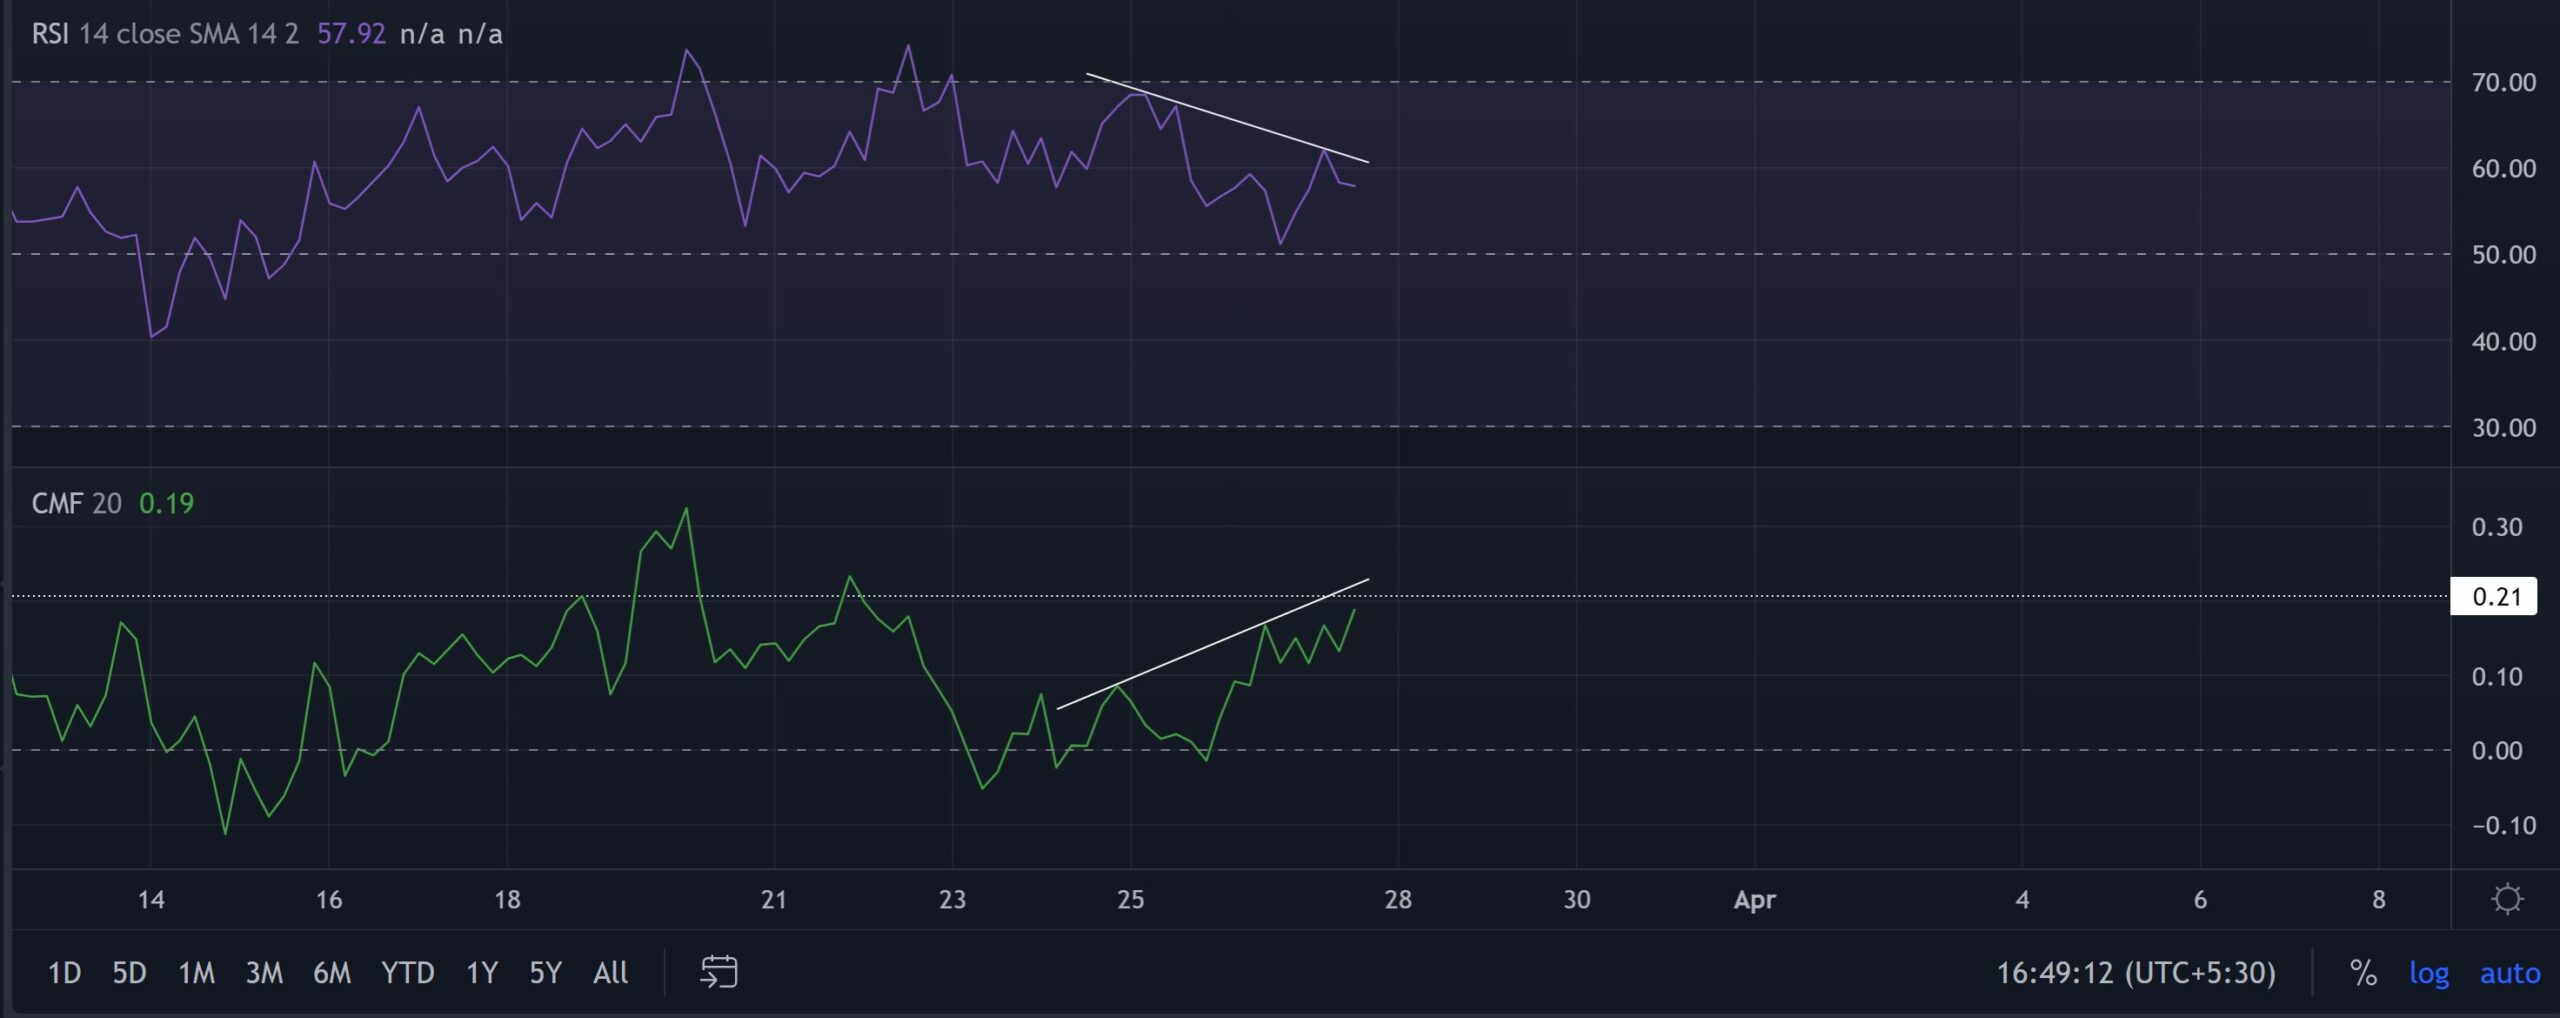
The RSI witnessed lower peaks while the price tested its immediate resistance over the last two days. This trajectory revealed a slightly weak bearish divergence of the RSI with the price. Any reversals would continue to find midline support.
Further, the CMF depicted a bullish edge as it endeavored to test the 0.21 level. A fall below this level would affirm a hidden bearish divergence with price.
Conclusion
Considering the current squeeze phase on its BB along with the potential divergences, LTC could see a near-term setback before the bulls gather force to snap the $126-level.
Besides, LTC shares a whopping 86% 30-day correlation with the king coin. A close eye on Bitcoin’s movement would be imperative to make a profitable move.