Litecoin crosses $80: Should you look out for a reversal now?
Litecoin was overvalued at press time. Will it put an end to LTC's price uptrend?

- LTC daily chart turned green as its value increased by over 1%.
- Market indicators and metrics looked pretty bearish on the coin.
Litecoin’s [LTC] price remained heavily under bears’ influence as the coin witnessed a major drop in its price. However, the coin tested a key support level, which can trigger a trend reversal. Therefore, AMBCrypto checked Litecoin’s metrics to see which way it was headed.
Litecoin bears are winning
CRYPTOWZRD, a popular crypto analyst, recently posted a tweet highlighting LTC’s bearish performance. This was the case as the coin’s price was testing the $80 key support level. If the coin managed to test that level, then there were chances of Litecoin gaining upward momentum and touching $94.
Thankfully LTC did actually manage to cross $80 as its daily chart turned green. According to CoinMarketCap, LTC was down by nearly 17% during the last seven days. But in the last 24 hours, the coin’s value increased by over 1%.
At the time of writing, LTC was trading at $81.4 with a market capitalization of over $6 billion.
AMBCrypto’s analysis of Glassnode’s data revealed that the uptrend might not last long. Our analysis pointed out that LTC’s Network Value to Transactions (NVT) ratio went up at a time when its price dropped.
Whenever the metric increases, it suggests that an asset is overvalued, which hints at a price correction.

Litecoin investors must be cautious
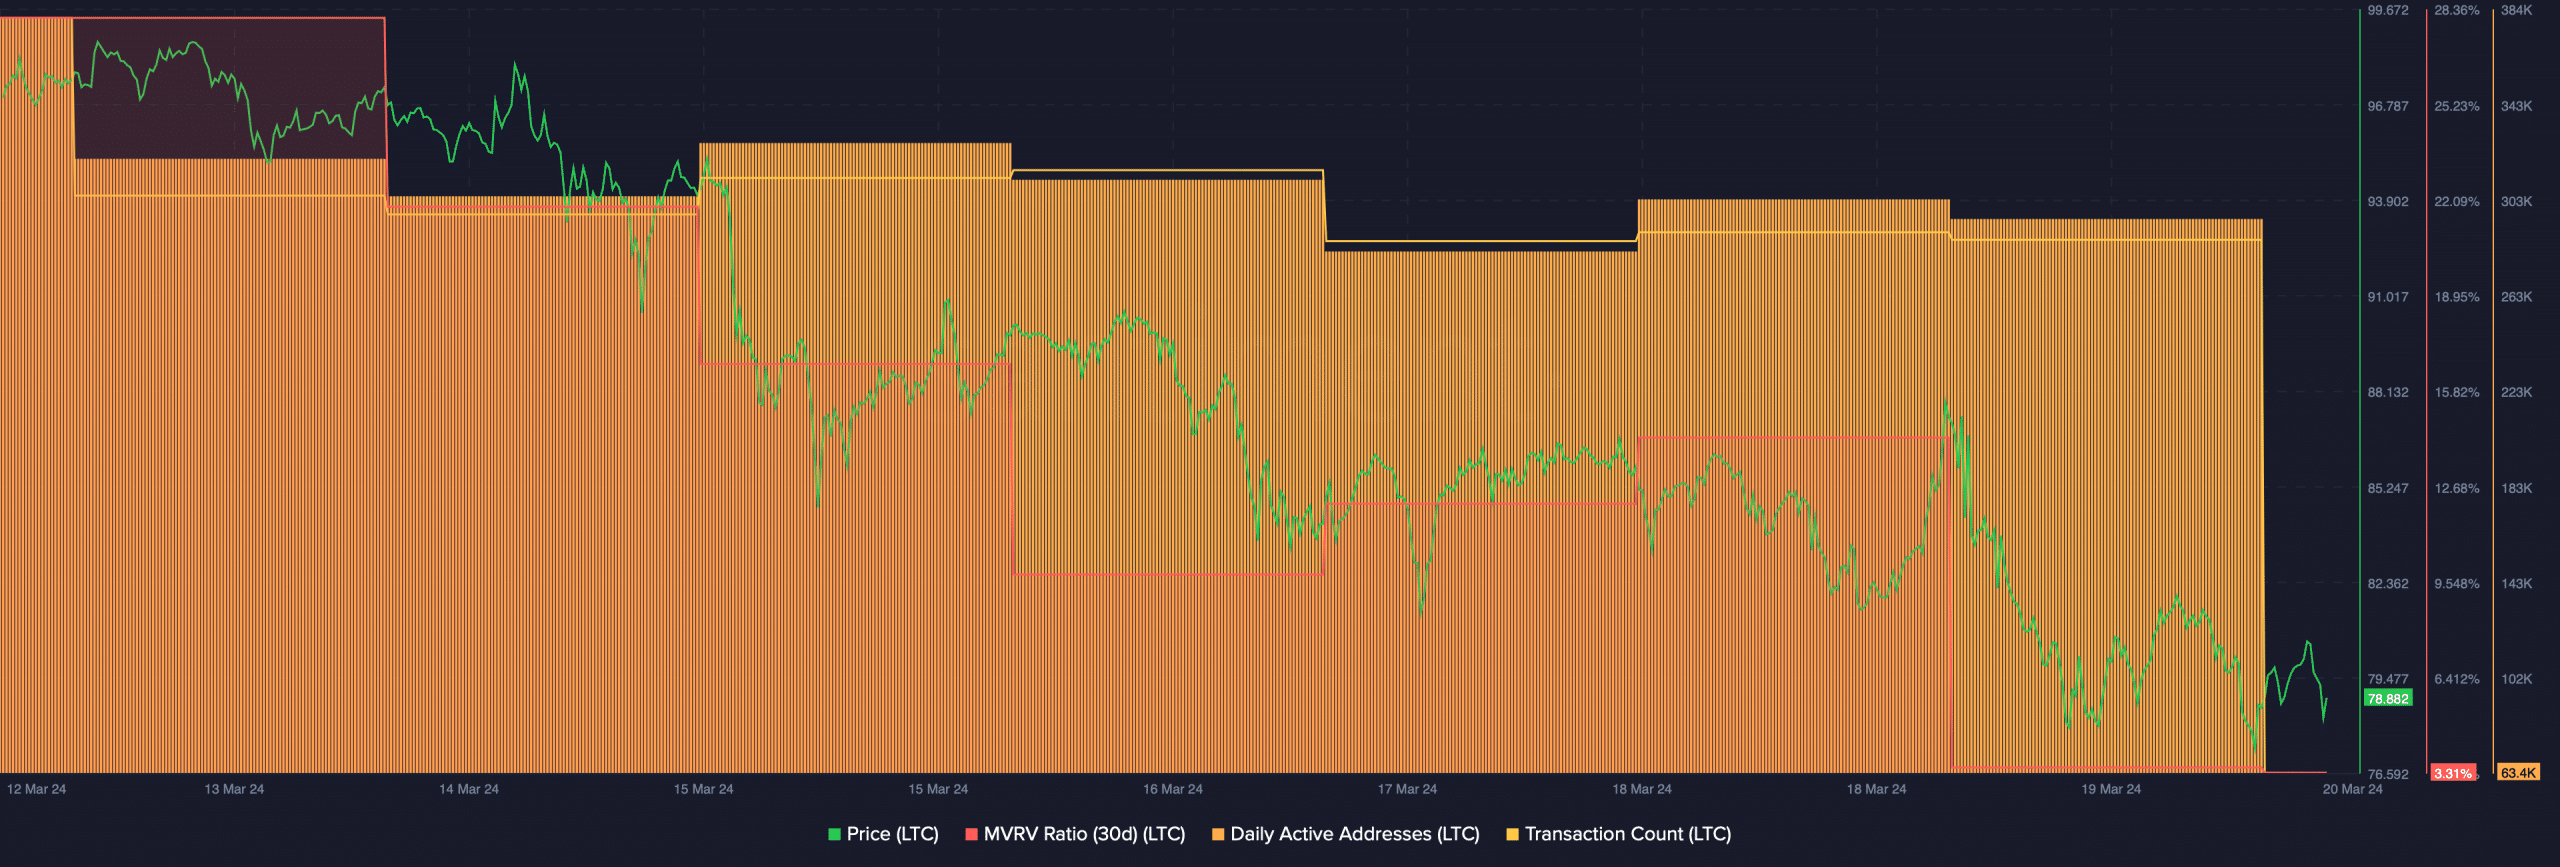
Since LTC’s NVT ratio increased, AMBCrypto checked other metrics to find whether LTC would again turn bearish. The coin’s MVRV ratio dropped sharply over the last week.
However, network activity remained high, as evident from its daily active addresses. Additionally, Litecoin’s transaction count was also high, suggesting that investors were actively trading.
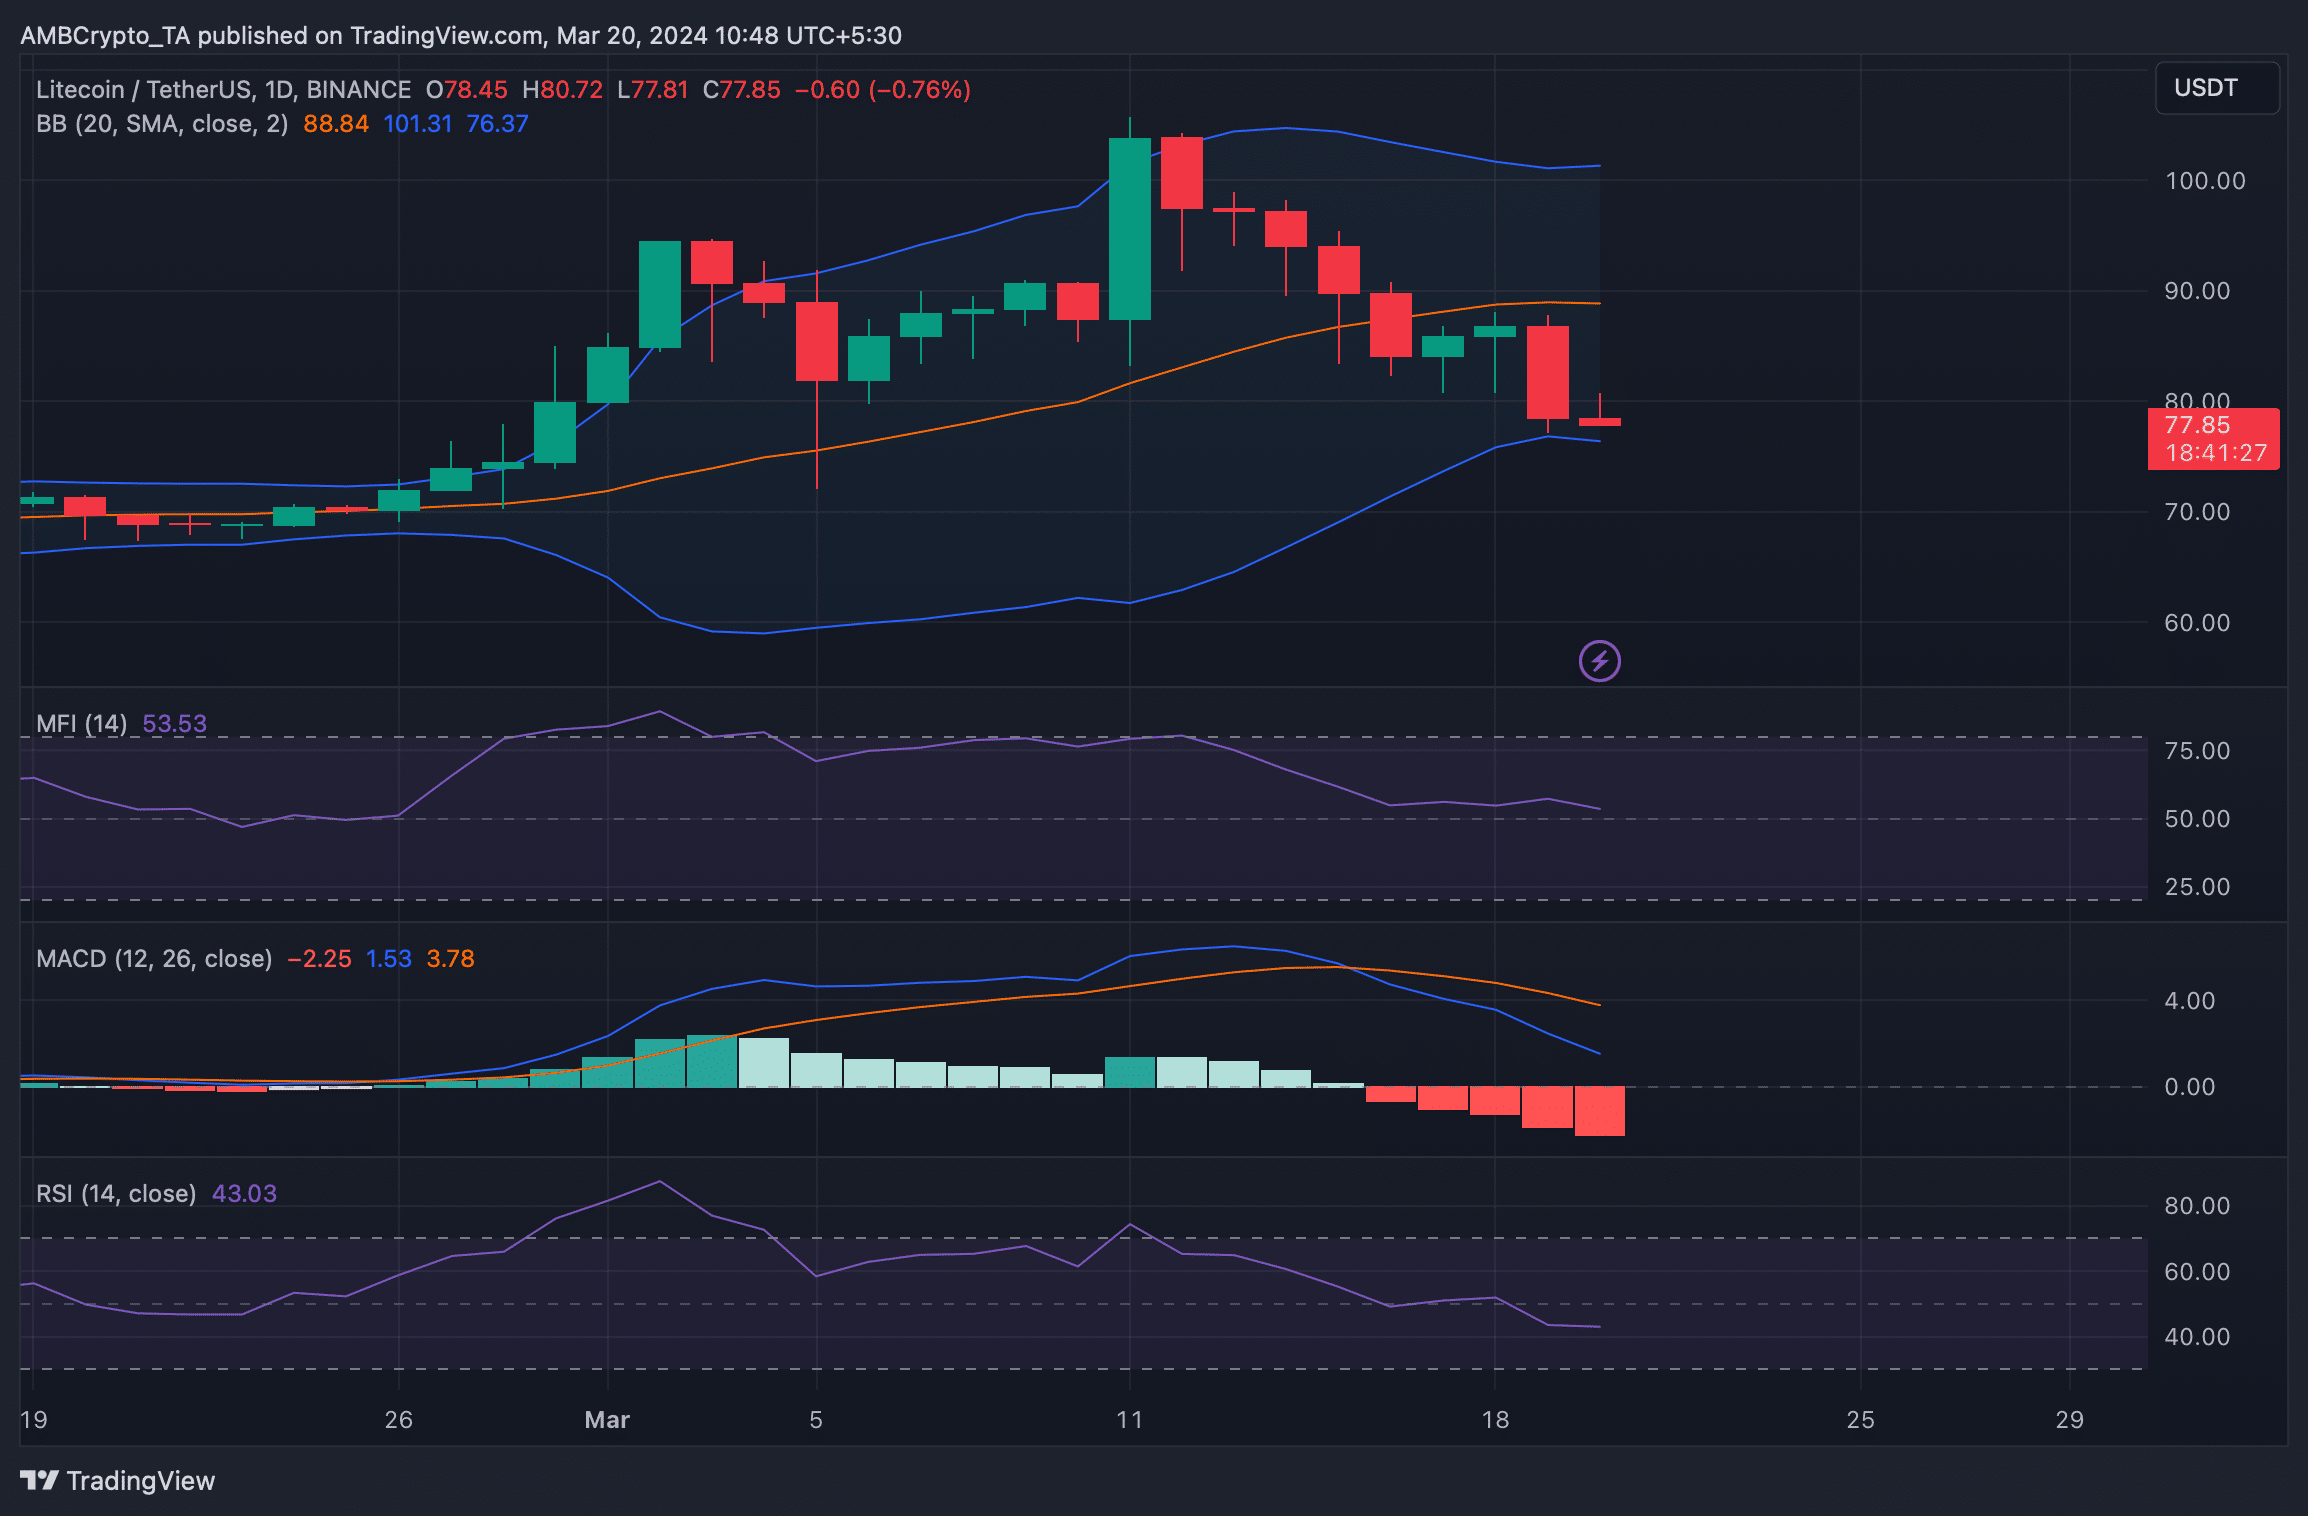
AMBCrypto then took a look at LTC’s daily chart and found that both its Relative Strength Index (RSI) and Money Flow Index (MFI) went sideways. This indicated that investors might witness a few slow-moving days.
The coin’s MACD displayed a clear bearish upperhand in the market. However, as per the Bollinger Bands, LTC’s price touched the lower limit of the metric, which suggested that there are chances of a continued price uptick in the coming days.
Read Litecoin’s [LTC] Price Prediction 2024-25
A quick look at LTC mining
While LTC’s price action remained volatile, miners were also behaving interestingly. Our analysis of Coinwarz’s chart revealed that after registering a sharp spike on the 18th of March, the blockchain’s hashrate went down.
This hinted that miners were exiting the Litecoin ecosystem. At press time, LTC had a hashrate of 929.86 TH/s.


