Litecoin, Ethereum Classic, Synthetix Price Analysis: 17 April

Litecoin and Synthetix traded between individual ascending channels, but a bullish broader market could delay the breakdowns over the coming sessions. When the breakdown does take place, LTC could dip towards $300, while SNX could do the same towards $18.4. Ethereum Classic showed a bearish divergence and was expected to stabilize at $40 or below before the next upswing.
Litecoin [LTC]
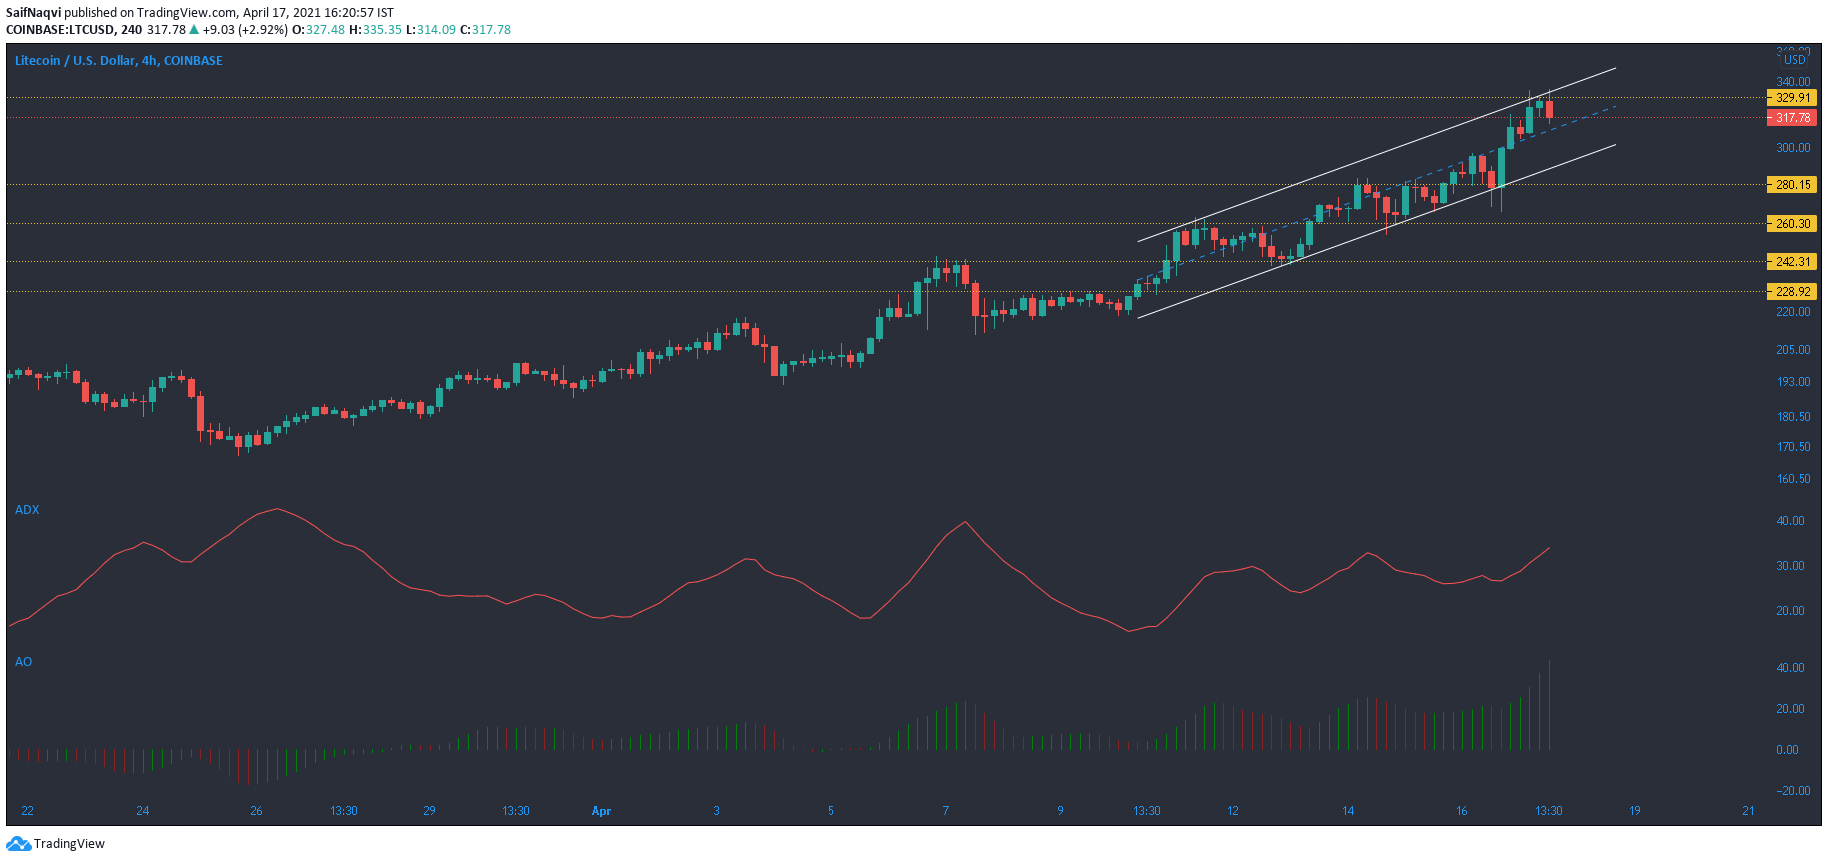
Large caps have been pumping off-late thanks to a bullish Bitcoin. With gains of nearly 40% in the last seven days, the world’s ninth-largest crypto, Litecoin, seems to have cashed in on the rally as well. On the 4-hour charts, an ascending channel was spotted which peaked above $330. While a southbound break is usually seen from this pattern, positive cues from the broader market could prevent such an outcome at least over the shorter-term
The ADX pointed north from 33 and suggested a strong trend in the market. Momentum was also on the buyers’ side according to the Awesome Oscillator. It was not clear when exactly a pullback would take place, but when it does, some support levels rested at $300 and $280.
Ethereum Classic [ETC]
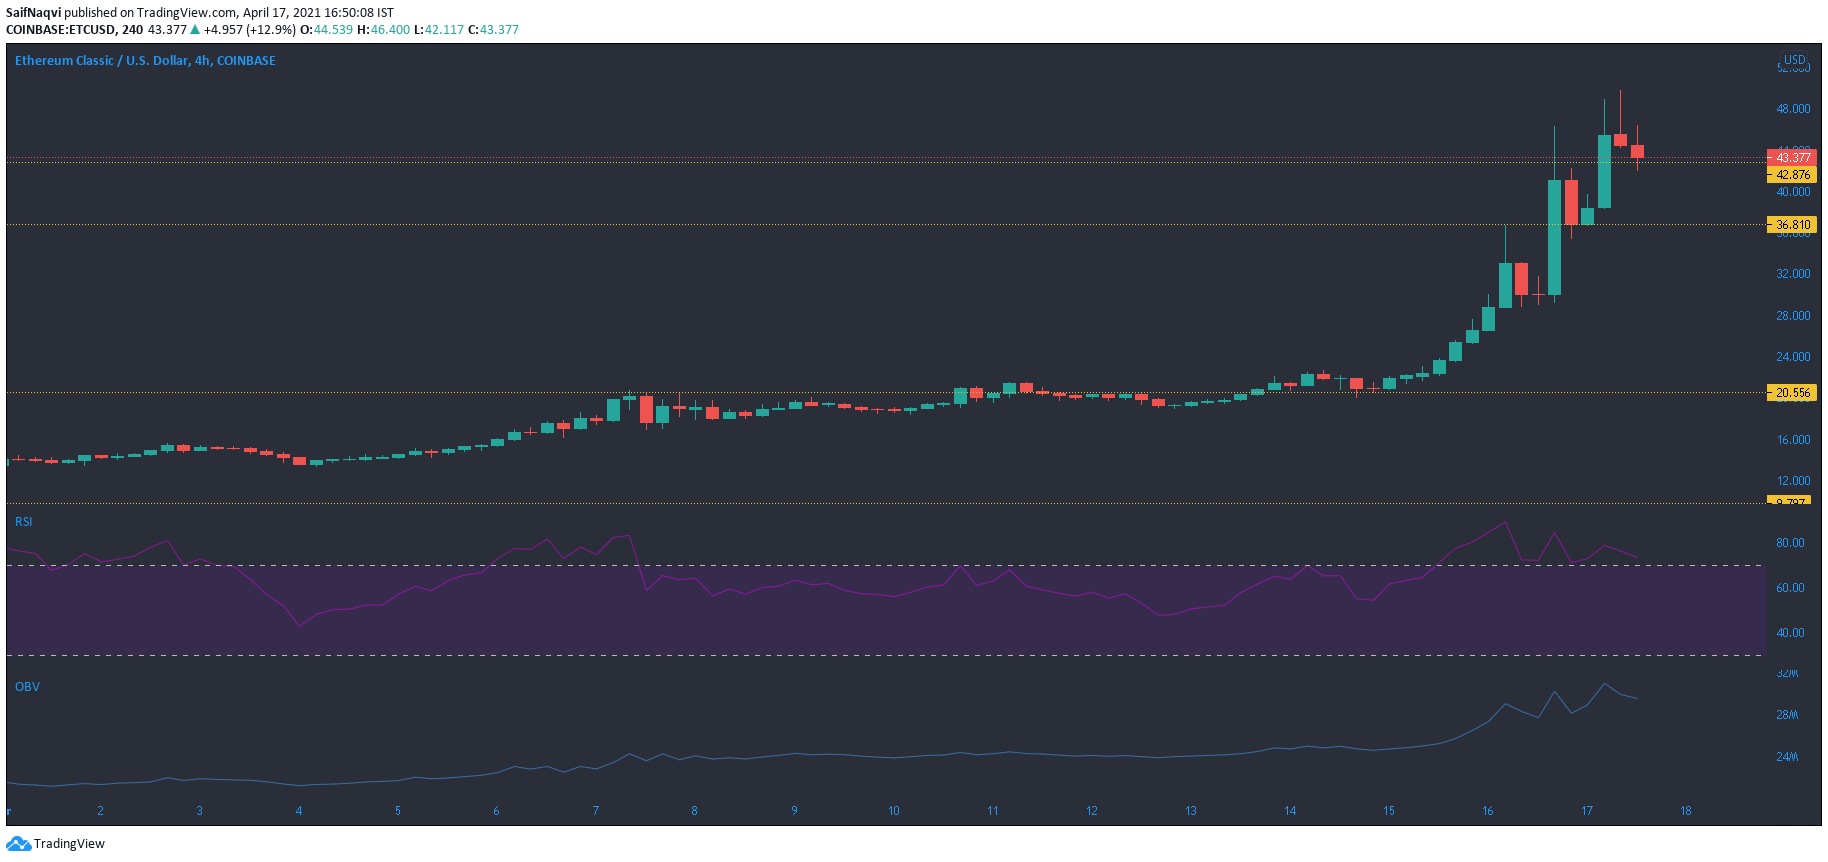
After trading rangebound between $9.7 and $14.2 during the month of March, Ethereum Classic shifted to an upcycle that saw a tremendous surge of 123% in the last seven days alone. The movement was quick to grab attention in the crypto market as traders jumped in on the rally. This was evident as the 24-hour trading volume clocked in at over $12.2 Billion, which was almost $7 billion more than the third-largest crypto – Binance Coin.
However, a couple of red candlesticks appeared on the 4-hour timeframe which begged the question – was this the end of ETC’s current uptrend? A look at the 1-hour timeframe showed a steady decline over the past few hours. Back to the longer timeframe, the RSI made lower highs and formed a bearish divergence. A similar divergence was also spotted on the OBV which dipped at the time of writing. On the plus side, a pullback could be cut short at $40 or $36 and ETC would likely resume its northbound movement post stabilization.
Synthetix [SNX]
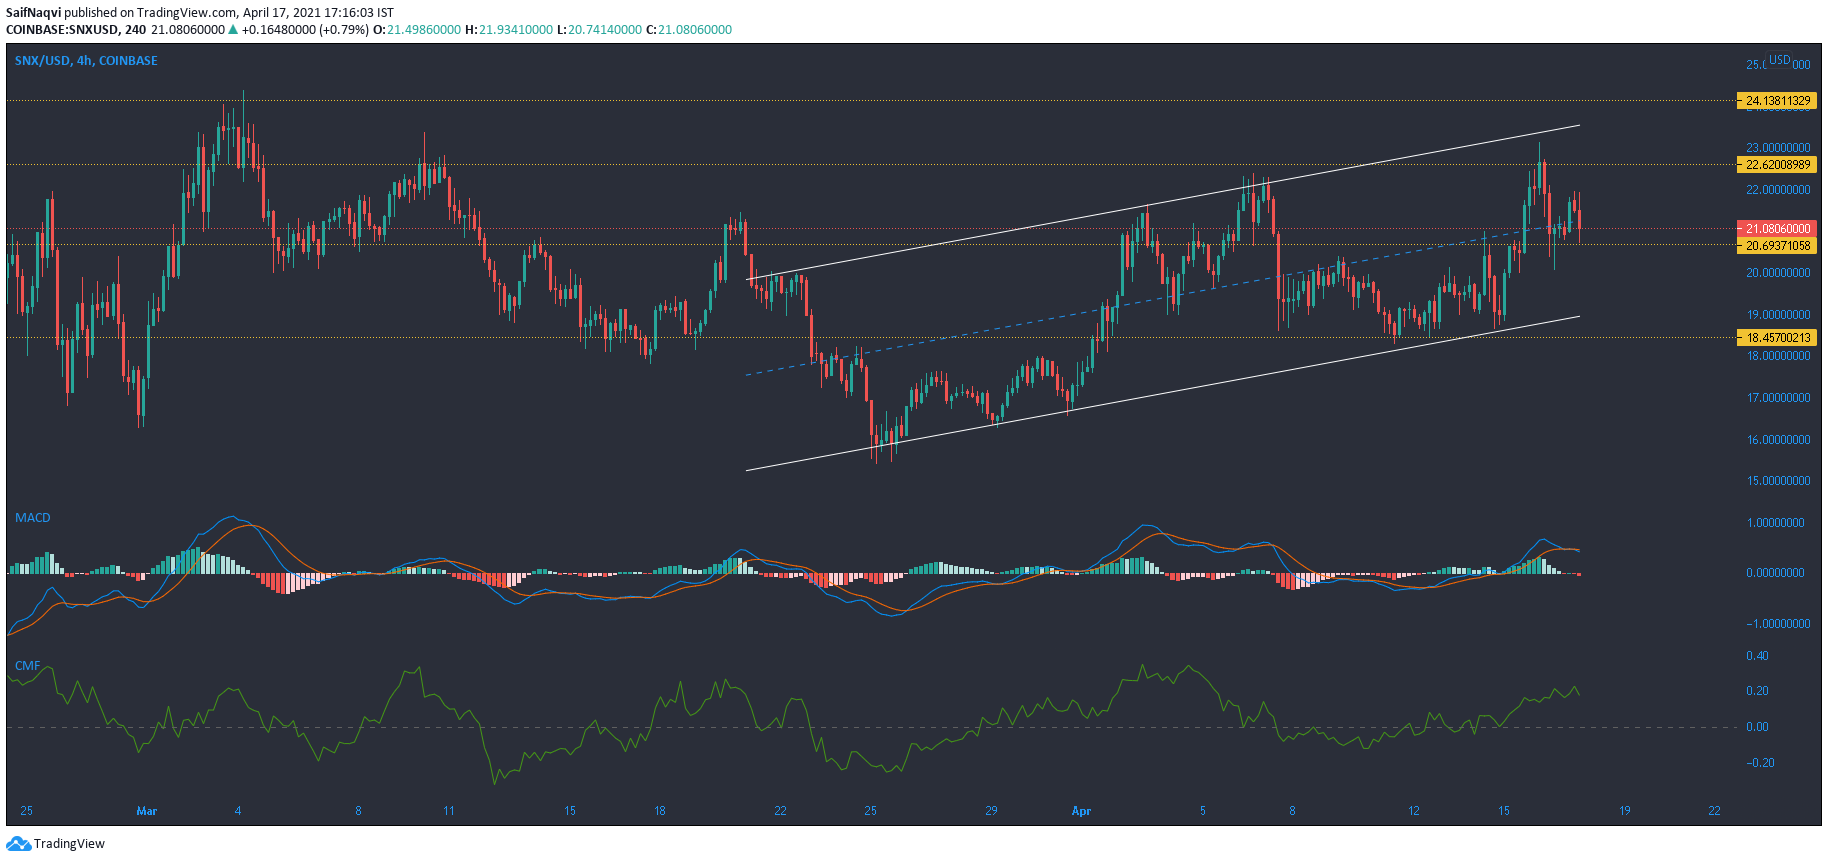
Synthetix moved within an ascending channel on the 4-hour chart and a breakdown could take place over the coming days. This was likely to happen at $24.1 resistance, a region that has previously been rejected by the sellers. While the MACD showed a bearish crossover, capital inflows were still healthy according to the Chaikin Money Flow.
This disagreement could work in favor of the bulls but a breakdown was expected nevertheless. Levels to watch out for in a bearish outcome include $18.45 or even $15.4.