Litecoin’s 10% and 124% hikes – What to expect from the price now?
The demand for Litecoin climbs as LTC turns profits for its holders.
- LTC led the altcoin market rally on the 2nd of April.
- Bullish sentiments remained in the coin’s spot market.
Litecoin [LTC] spiked by almost 10% on the 2nd of April to lead the altcoin market rally during that day’s intraday trading session, Santiment noted in a post on X (formerly Twitter).
⚡️📈 #Litecoin (+8.9%) is well ahead of the #altcoin pack in the past 24 hours, powered by significantly higher transaction volume than usual throughout the past month. More importantly, the average of $LTC investments is getting younger, indicating whales are moving more coins… pic.twitter.com/YUBTqi3mXu
— Santiment (@santimentfeed) April 2, 2024
According to the on-chain data provider, the surge in the coin’s price was due to the rally in its transaction volume in the past month.
Assessed on a 30-day moving average, LTC’s daily transaction volume climbed by 124% in the past month.
Santiment further noted that the price hike was due to the re-emergence of dormant whale addresses who moved their coins around to benefit from LTC’s month-long price growth.
Also observed using a 30-day moving average, LTC’s Mean Dollar Invested Age metric has trended downwards since the 4th of March.
This metric measures how long investors have been holding their assets relative to current market conditions.
When the metric rises, it suggests that more investors are holding onto their coins for longer periods rather than actively trading them. During this period, there is less trading activity and a decline in coin supply.
Conversely, when the metric declines, it means that there is higher trading activity in the market as coins change hands swiftly, resulting in a hike in the number of coins in circulation.
Bullish outlook remains strong
According to CoinMarketCap’s data, LTC had experienced a double-digit price rally in the last month and was trading at $103 at press time.
Key momentum indicators observed on a 24-hour chart showed an uptick in demand for the coin. As of this writing, the values of its Relative Strength Index (RSI) and Money Flow Index (MFI) were 57.72 and 65.18.
With values above their respective center lines, these indicators showed that market participants preferred buying more LTC than selling their holdings.
The coin’s Chaikin Money Flow (CMF) was positive at press time, confirming the accumulation trend. A CMF value above zero signals liquidity inflow into the market, thus showing that the bullish trend is strong.
Read Litecoin’s [LTC] Price Prediction 2024-25
Also, regarding the current market trend, LTC’s Aroon Up Line (orange) was 85.71%. This indicator measures an asset’s trend strength and potential trend reversal points in its price.
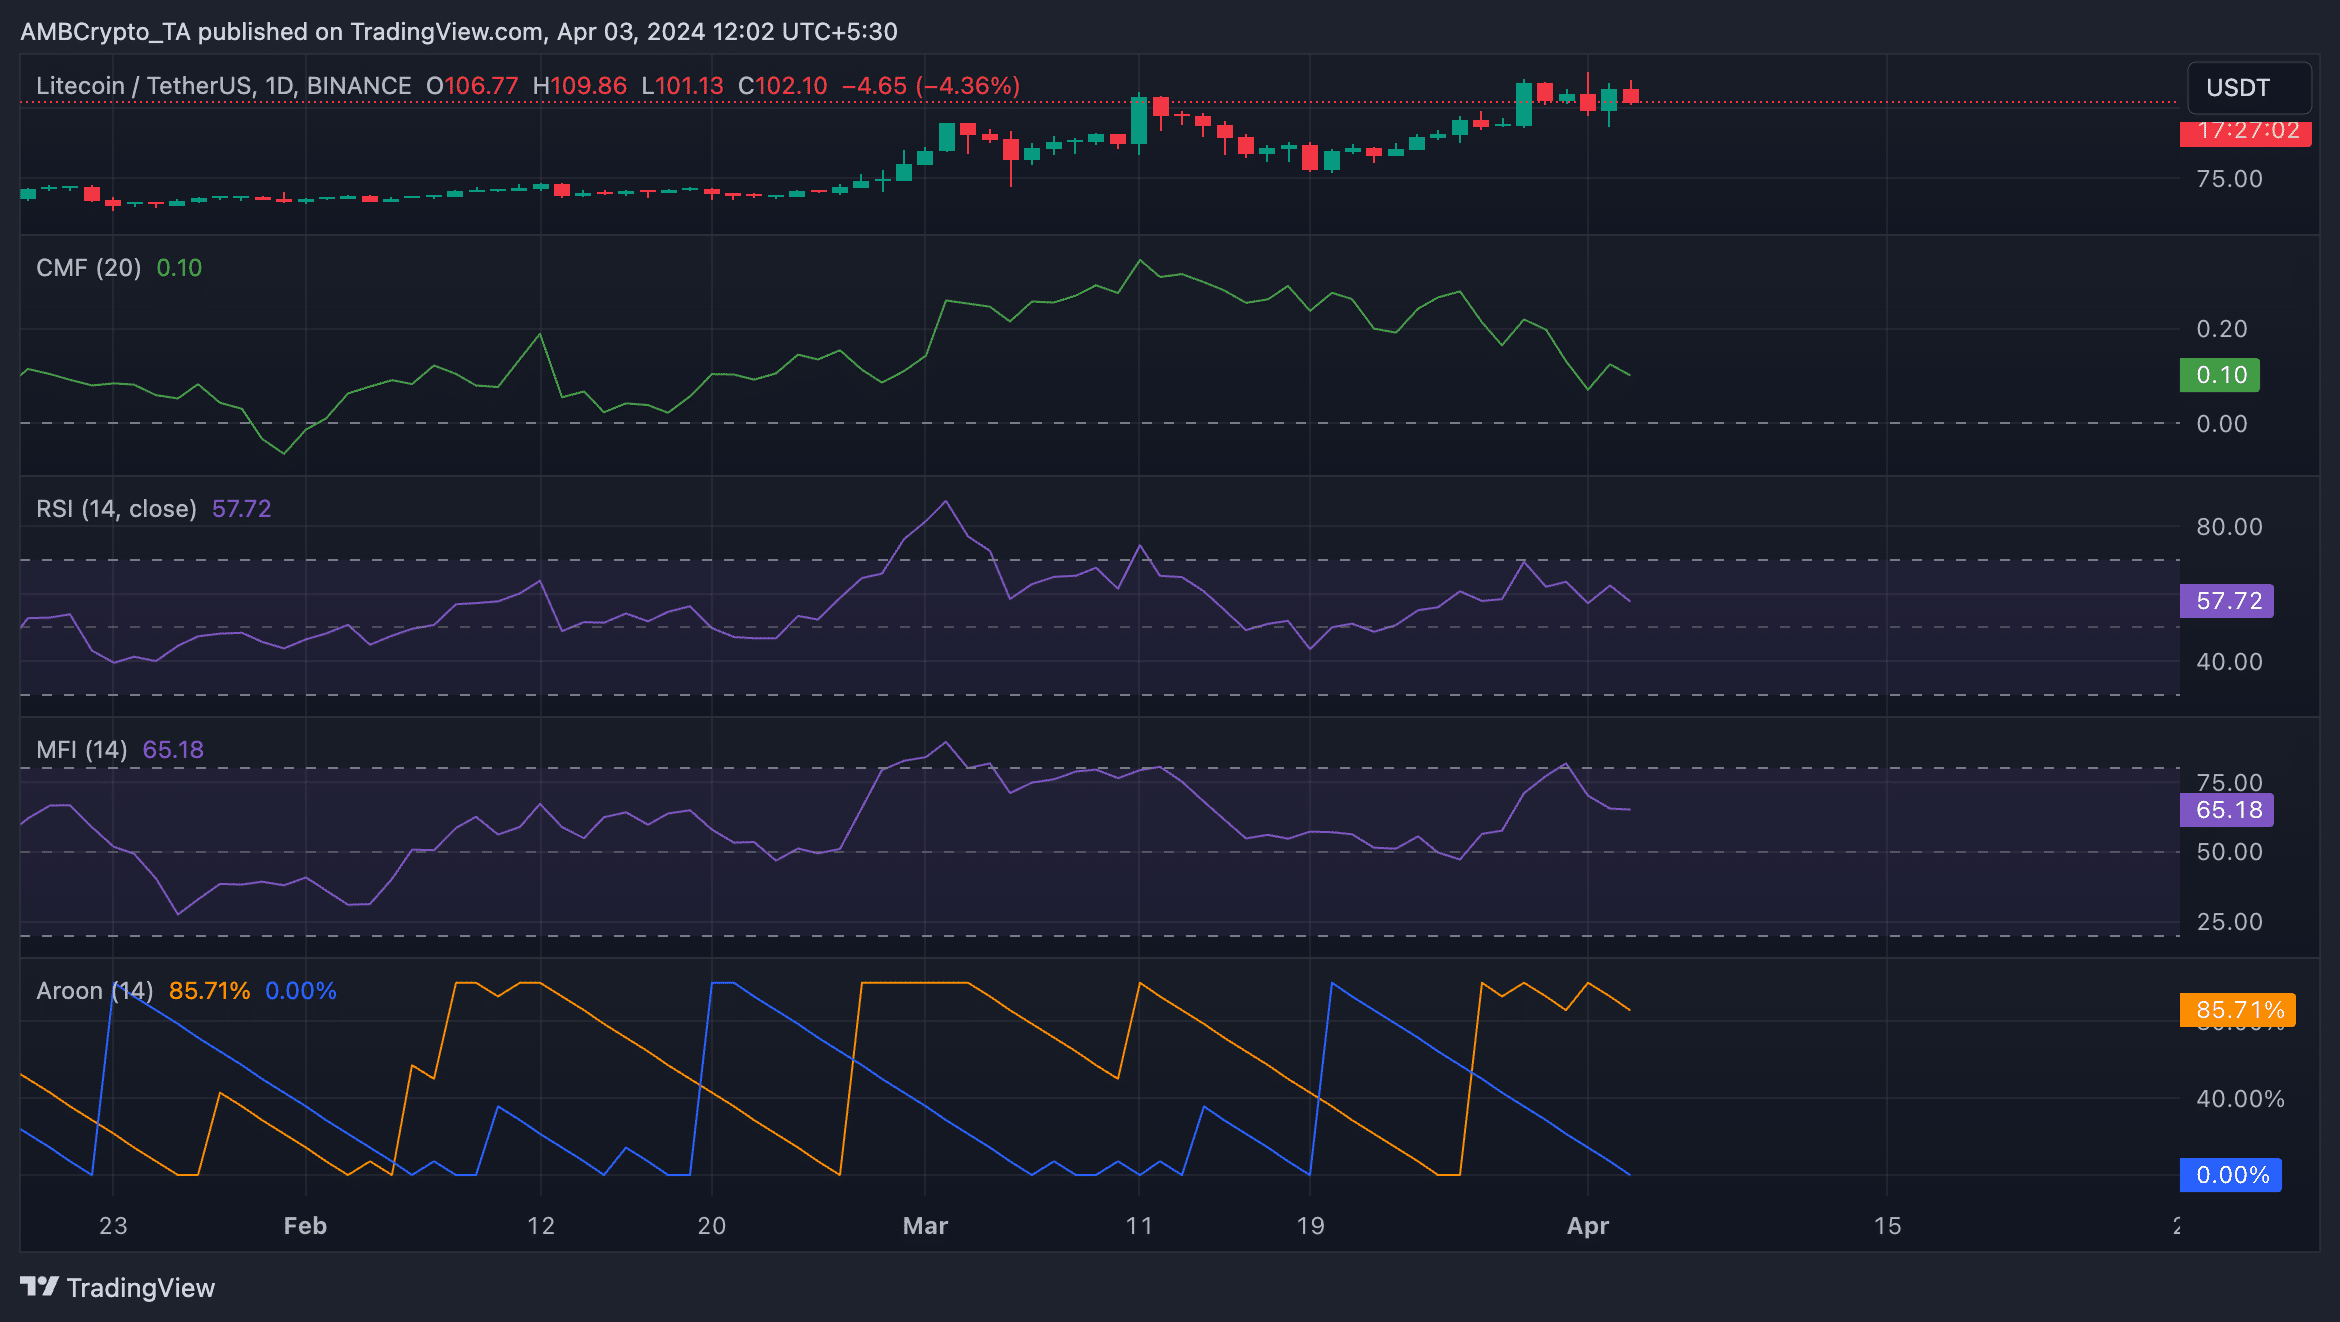
When the Up Line is close to 100, it indicates that the uptrend is strong and that the most recent high was reached relatively recently.


