Is Litecoin back after Bitcoin’s recent rally? The answer is…
Litecoin's performance against Bitcoin shows that LTC could be in an uptrend.

- The Litecoin/Tether chart was completely different to the Litecoin/Bitcoin chart
- Investors would be debating whether LTC could catch up to BTC’s performance this year
Litecoin [LTC] performed well on the 2nd of April, leading a rally while Bitcoin [BTC] prices continued to slump. However, later that day, LTC went on to retrace almost all the gains made a few hours earlier.
However, the near 15% bounce from $95.6 to $109.86 occurred on a heavy bout of trading volume. It gave investors hope that LTC could have begun an uptrend.
Examining the HTF price action- has Litecoin initiated an uptrend?
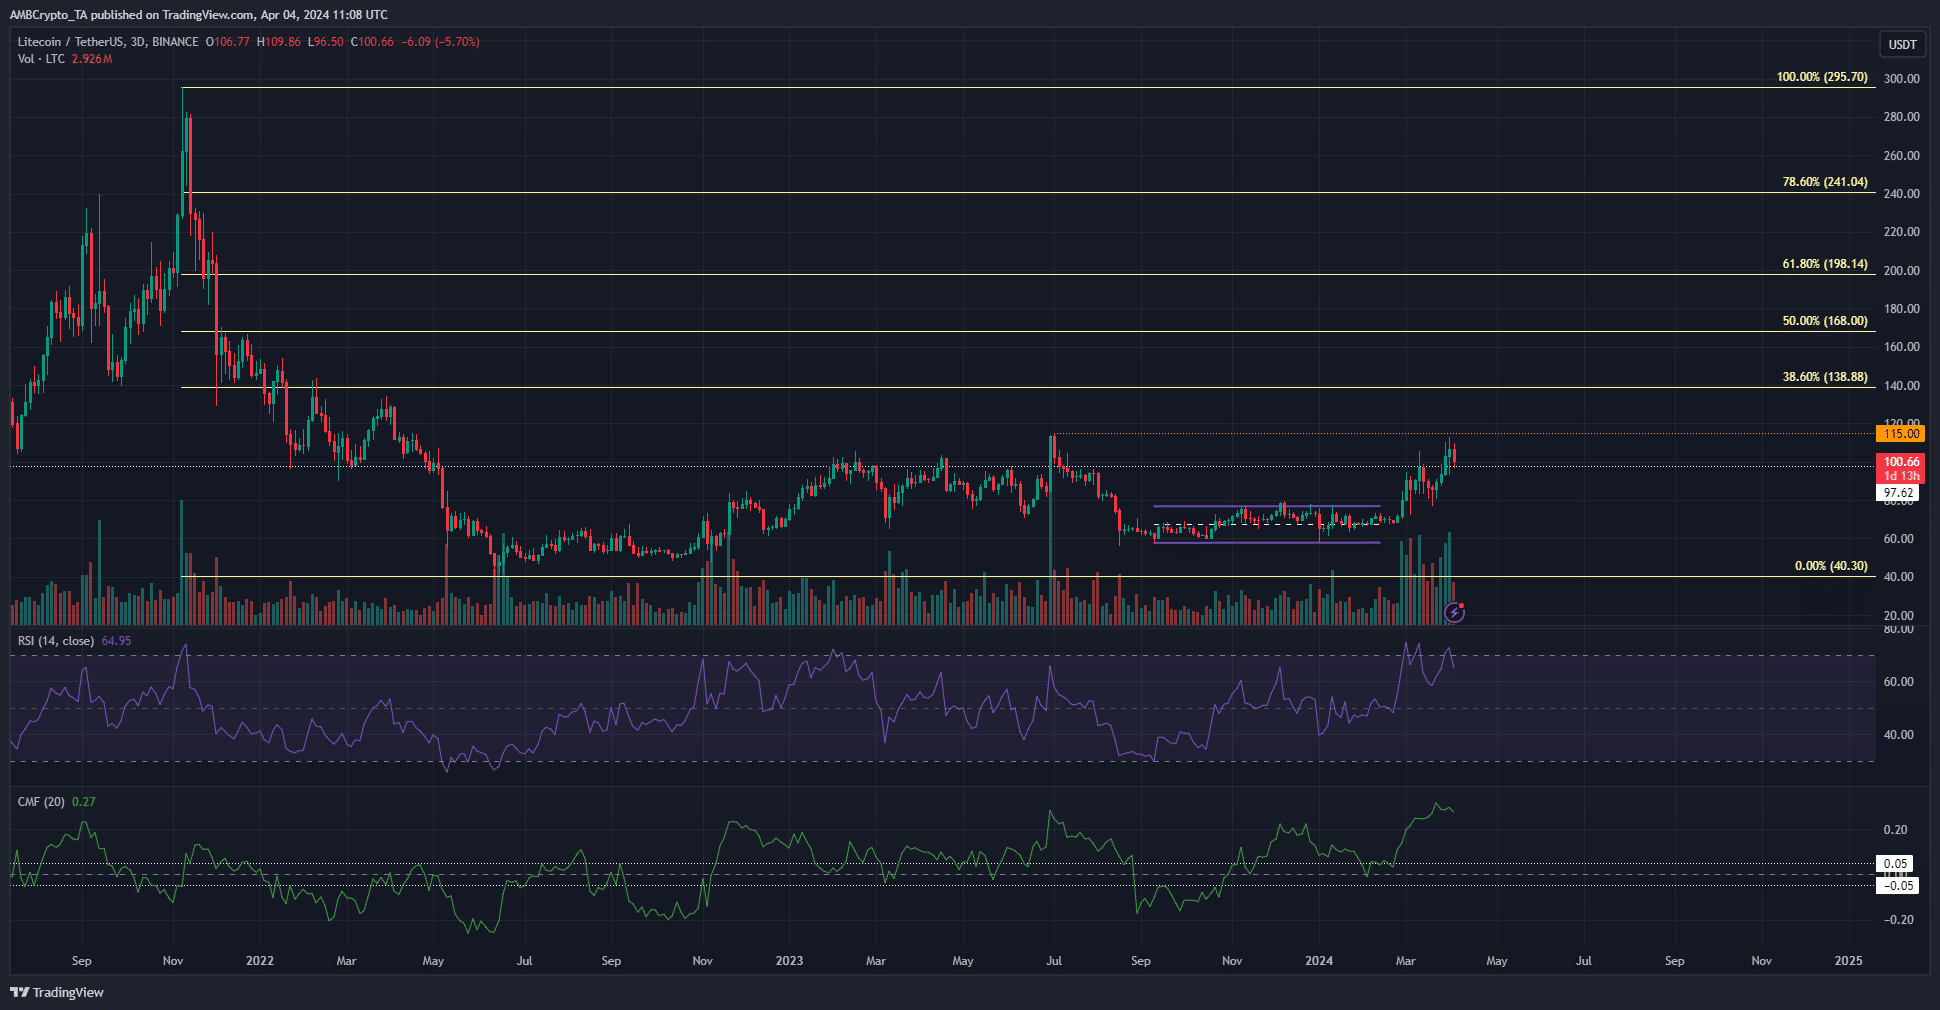
The breakout past the Q4 2023 range (purple) highs at $79.5 flipped the D3 structure bullishly. The technical indicators on the 3-day chart were firmly positive. The trading volume, as mentioned, was consistently higher than it has been throughout 2023 (with one exception- the 30th of June).
The D3 RSI and the CMF also noted strength from bulls in March. Together they showed significant capital flow into the LTC market. This has propelled prices higher in recent weeks.
It was hugely encouraging that the $80 level was retested as support in early March. The fact that the bulls were able to defend it indicated buyers were adamant.
A look at the weekly chart showed that a move past $115 would show a bullish market structure on the 1-week chart. If LTC bulls achieve that, the price action from May 2022 to press time would have been a lengthy preamble, a consolidation phase, before the next bull run.
How does Litecoin stack up against Bitcoin?
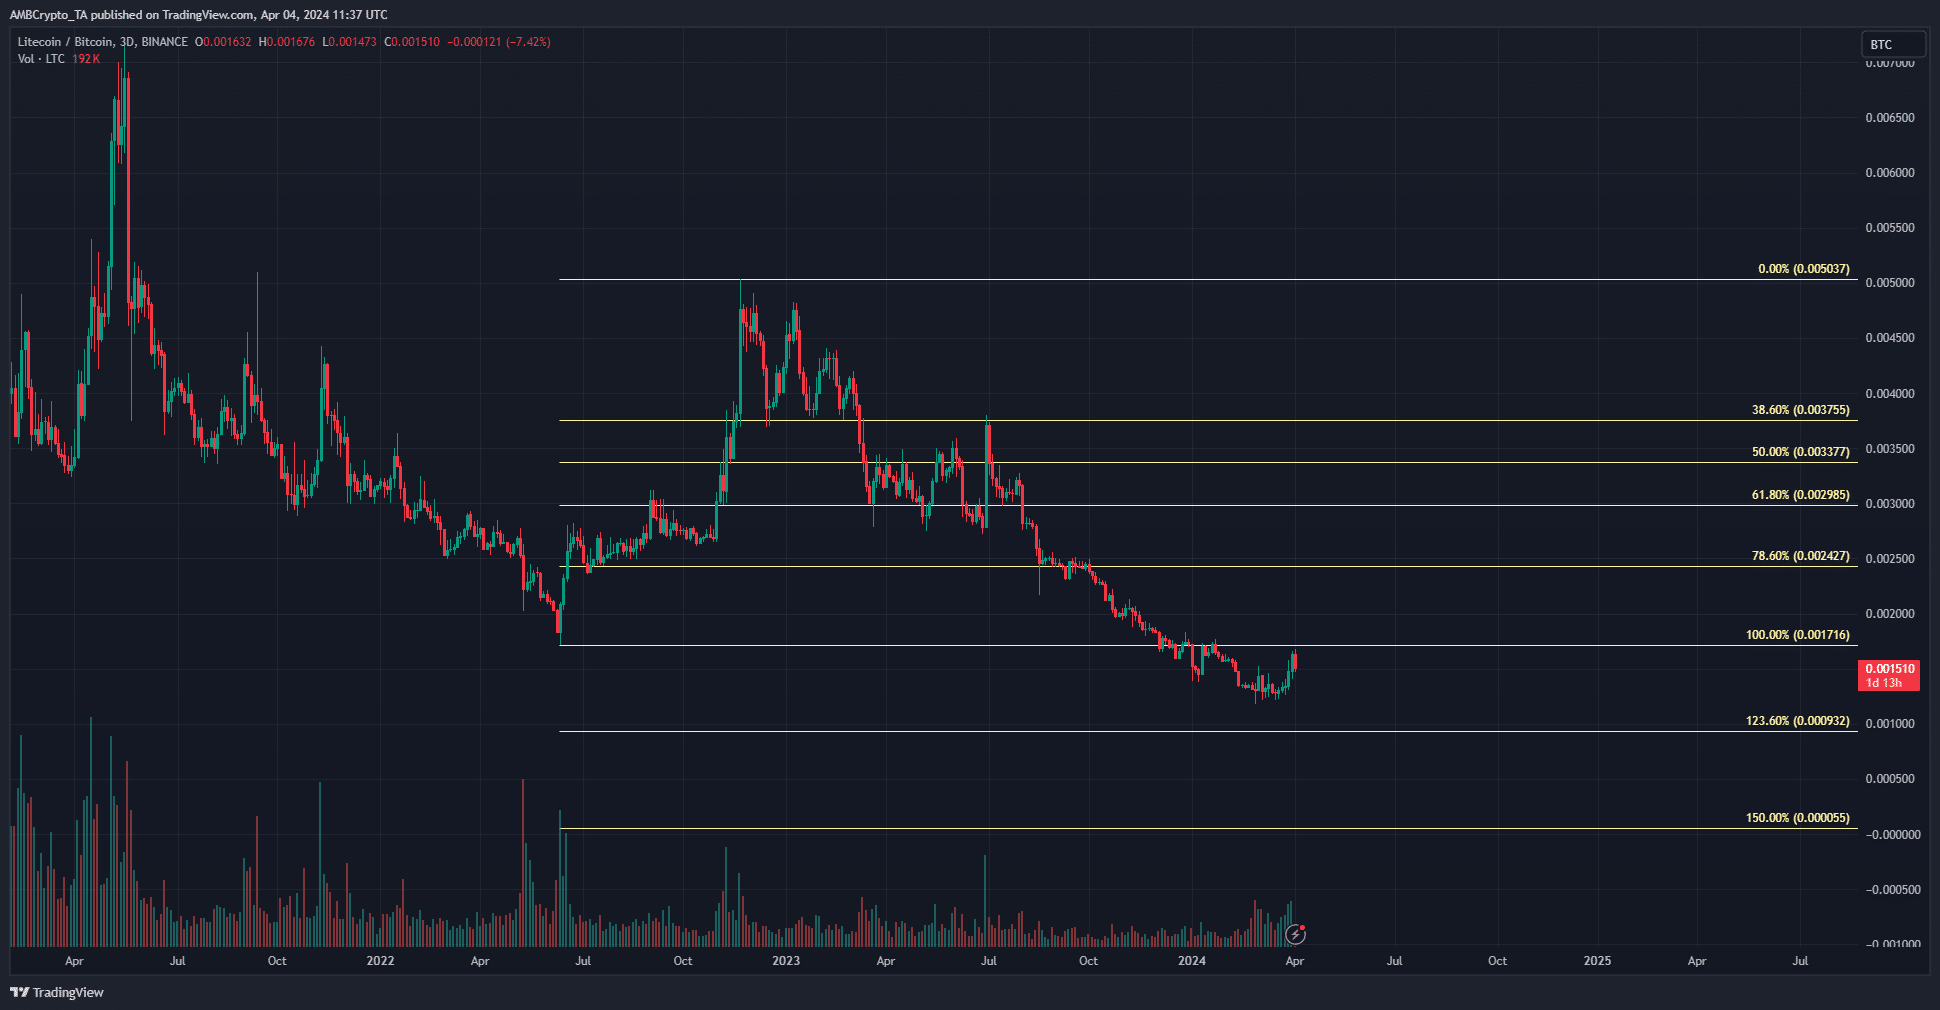
While Litecoin has a bullish structure against USDT, a stablecoin, it has been in a severe downtrend against Bitcoin since early 2023. The Fibonacci levels showed that further losses were expected and highlighted where the LTC/BTC pair was set to move.
The chart above shows that Bitcoin has majorly and consistently outperformed Litecoin. This compounded the argument that Litecoin was a legacy token whose bull runs were vastly eclipsed by newer, shinier tokens.
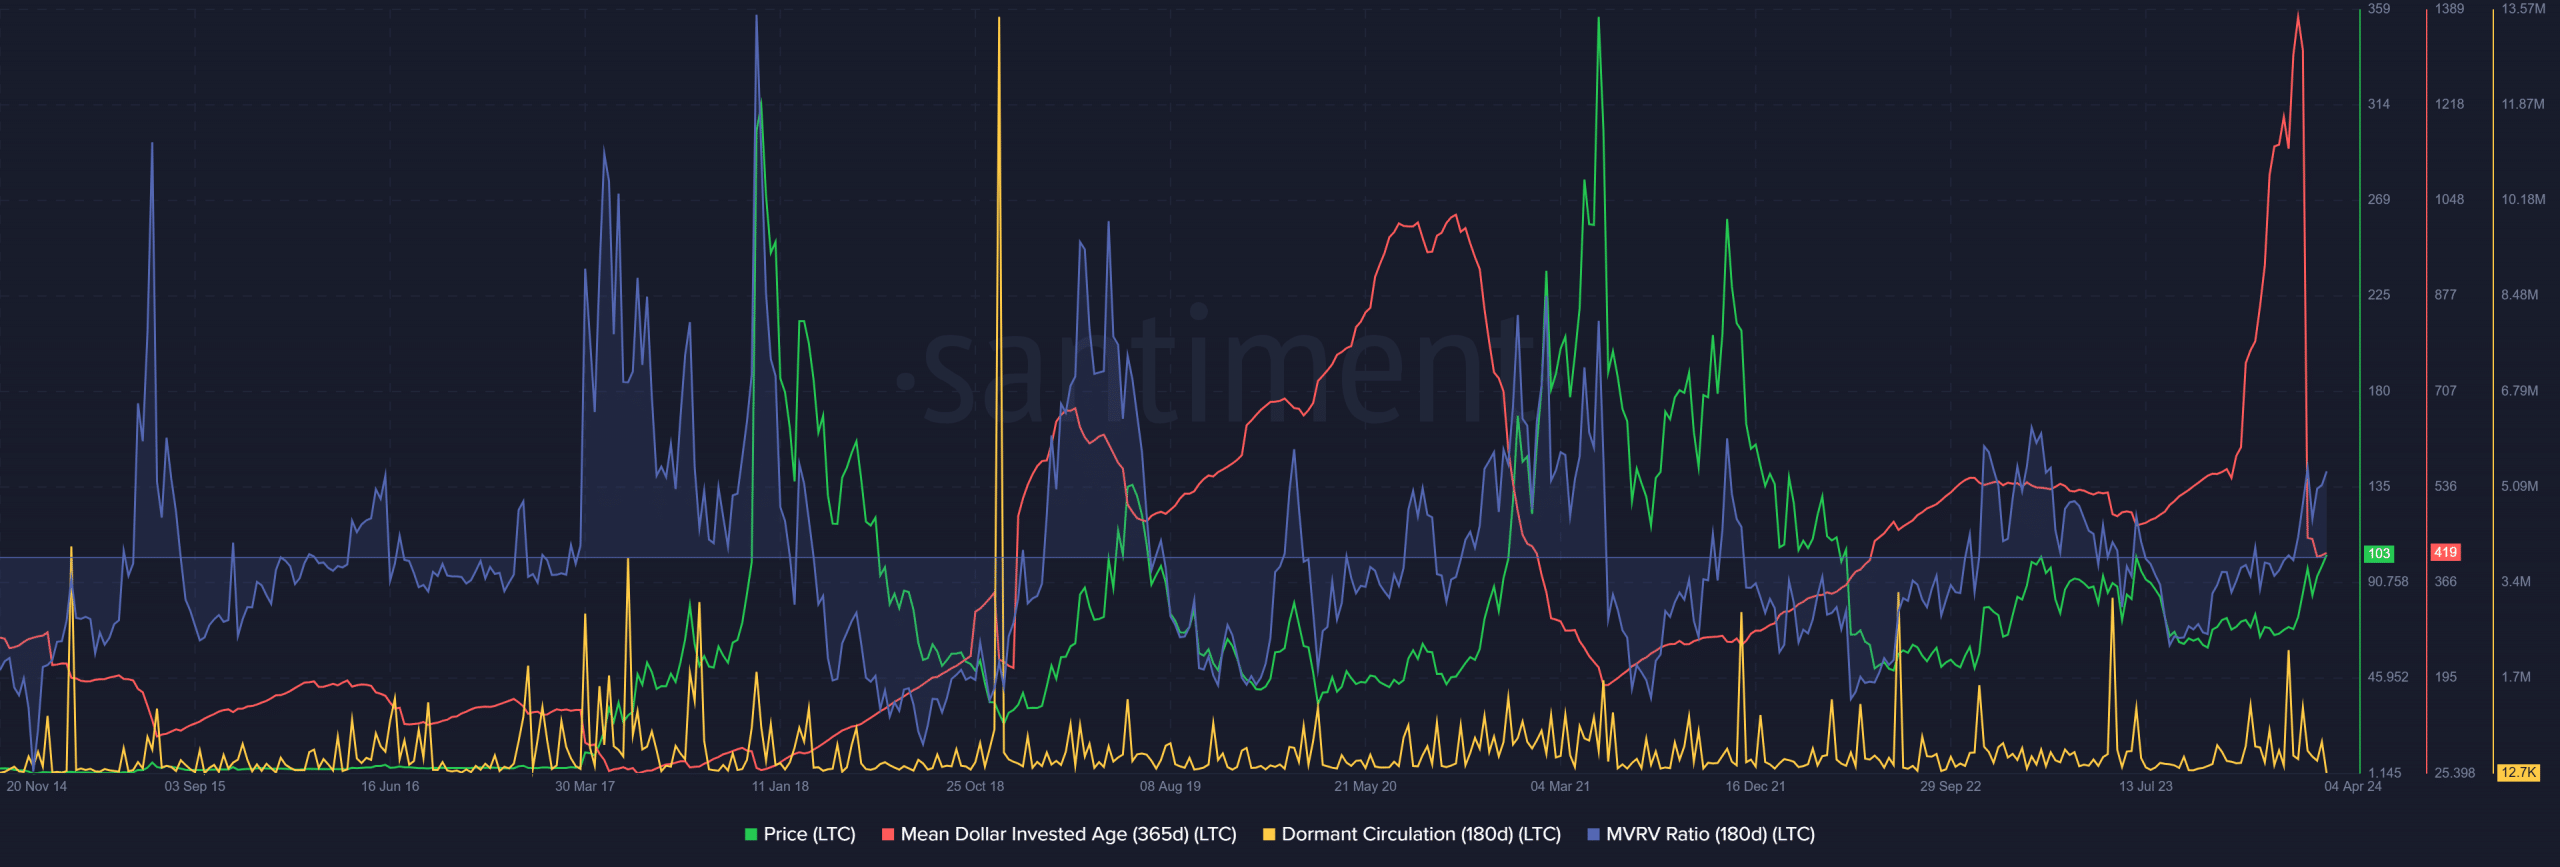
Examination of Santiment metrics showed that the mean dollar invested age plummeted over the past month as Litecoin prices ascended. This was a bullish sign as the MDIA usually enters a strong downtrend when the prices trend upward.
It is a sign of older coins re-entering circulation. A similar trend was seen during the period from May-August 2020. Once Litecoin embarked on an uptrend, the MDIA began to fall rapidly.
Read Litecoin’s [LTC] Price Prediction 2024-25
The dormant circulation saw sizeable spikes in February when it was beneath the $80 resistance. It underlined waves of selling pressure, but not much activity was spotted in the past month.
The MVRV ratio was in an uptrend and showed holders were at a profit.


