


Between the 23rd and 26th of September, Litecoin saw a drop in value from around $74 to $50, and has since been unable to rise above the $67 mark. LTC has been mostly consolidating between the $55 and $60 range, and is worth $58.22 at the time of writing. According to CoinMarketCap, Litecoin has a market capitalization of over $3.7 billion, and a daily trading volume of around $3.1 billion. It was traded most on the CoinEgg exchange, which accounted for 10.7% of trades over the 24 hour period.
Litecoin 1-hour chart

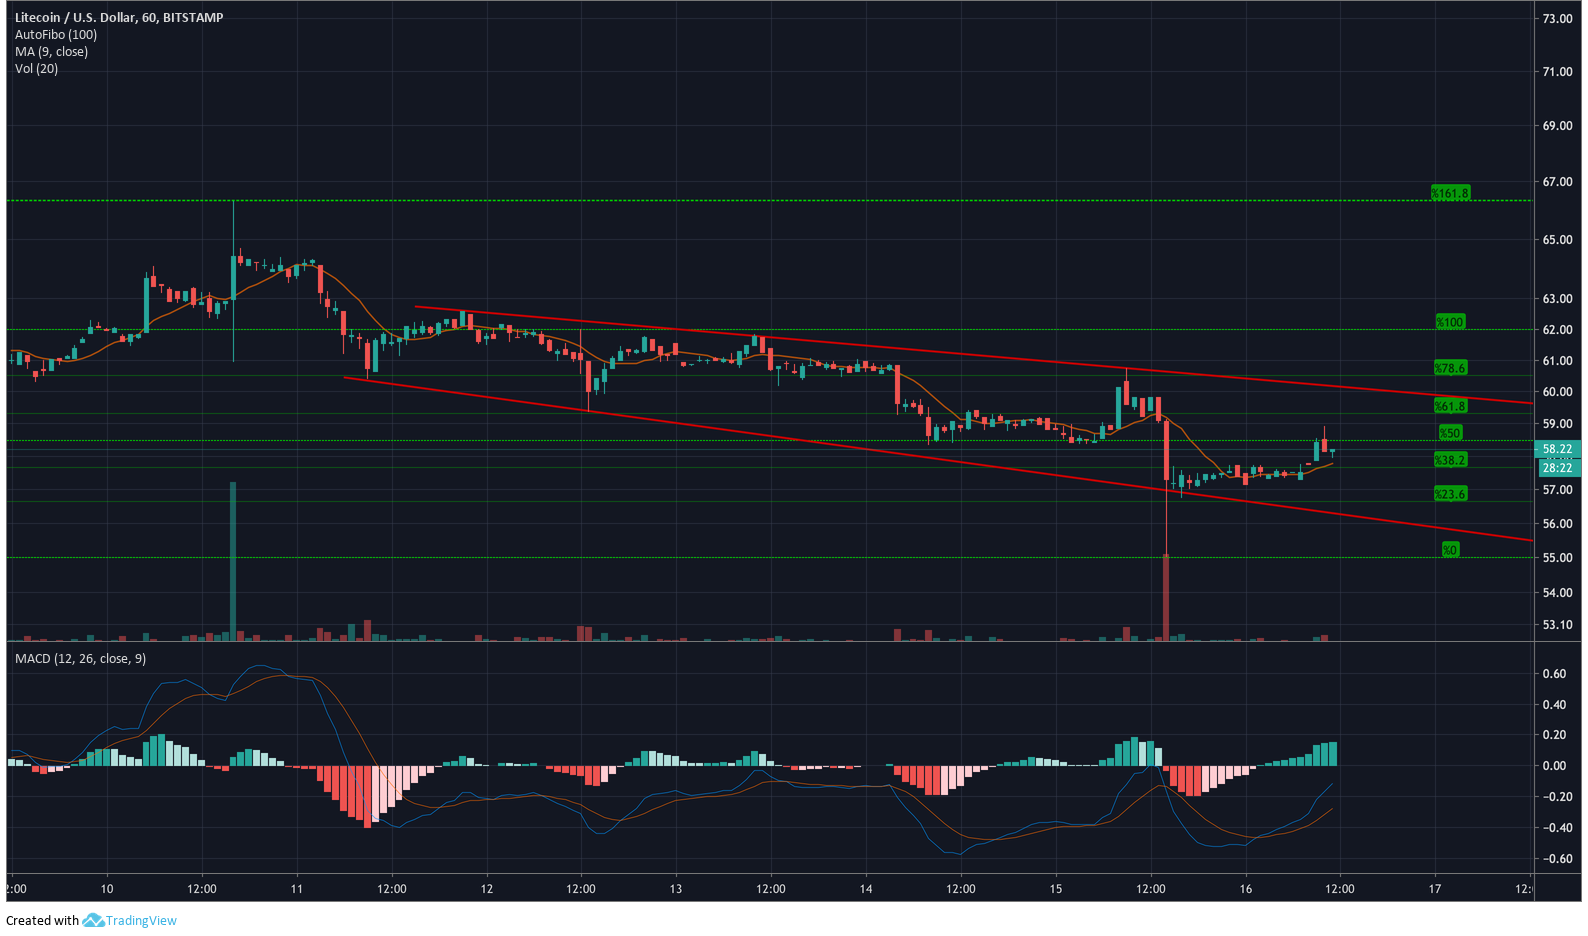
As shown in the chart, Litecoin entered a descending broadening wedge pattern last week, though it does not exhibit the expected increasing volume trend. Descending broadening wedges tend to breakout in the direction that price enters from 58% of the time, which in this case means it is more likely that LTC will move downward in the short-term.
However, these patterns also generally tend to breakout upward 72% of the time overall, giving Litecoin a good chance for a bullish movement.
The 9MA moving under the price line is also a good indicator of short-term upward movement. MACD had also exhibited a recent bullish crossover, with the signal line moving under the MACD line, and relatively high bullish momentum. Looking at the chart, Litecoin can be seen to have retraced from the 50% Fibonacci line, indicating a likely move downward for the time being, followed by an eventual break-out.
While it is possible that LTC could break downward from the pattern, indicators are currently predicting bullish movements. A break downward could see its value go as low as $54 in the next few days. The more likely scenario, where LTC moves up, will probably see a breakout to above $62 sometime during next week.