Litecoin [LTC] bounces from $90, will there be a breakout past $100 this time?

Disclaimer: The information presented does not constitute financial, investment, trading, or other types of advice and is solely the writer’s opinion.
- The four-hour market structure was broken, and a minor pullback could commence.
- The overall bias was bullish for Litecoin.
Litecoin [LTC] slumped to $88.16 on 13 February, while Bitcoin [BTC] dipped to $21.3k. Since then, both assets have rebounded higher on the price charts. This was encouraging for the bulls. Litecoin buyers, in particular, have been vigorous in February 2023.
Read Litecoin’s [LTC] Price Prediction 2023-24
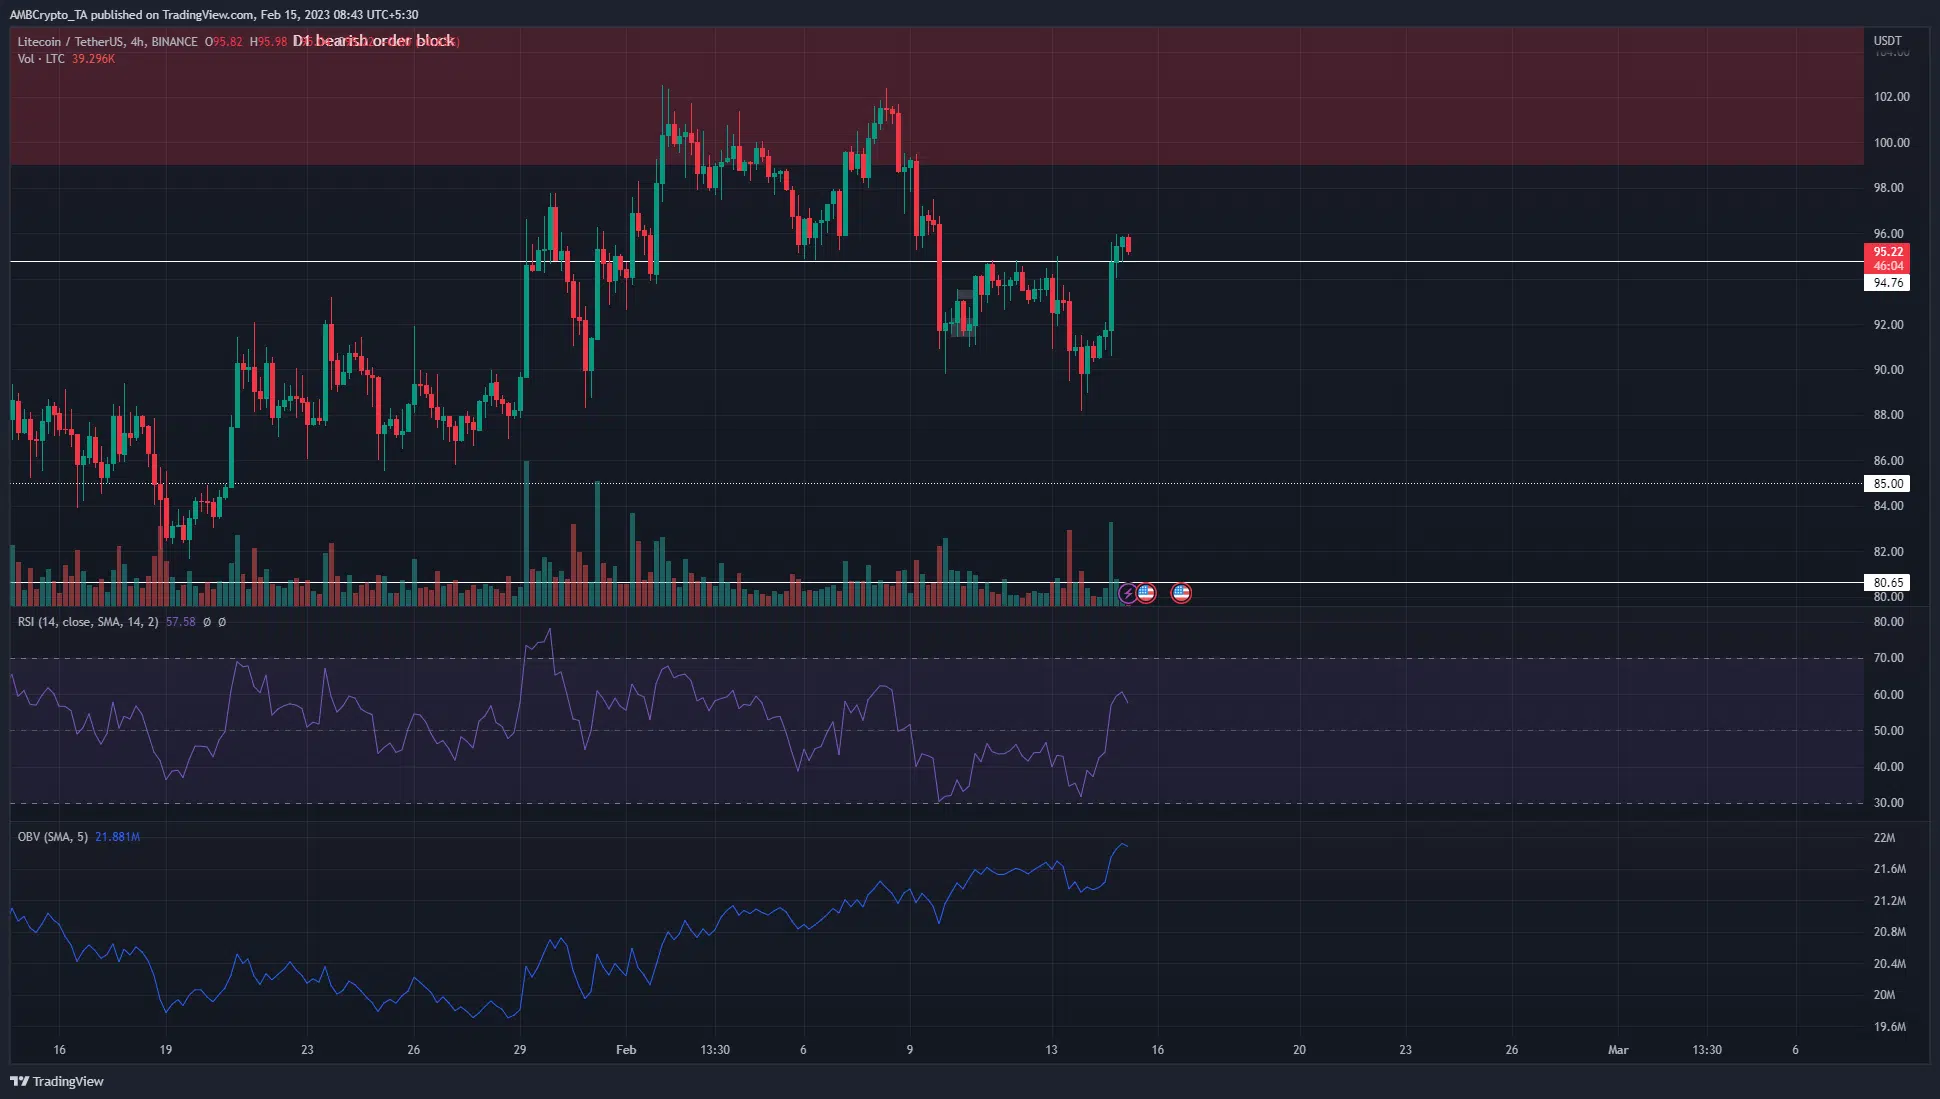
The quick surge from $88 to $96 showed bullish strength. Lower timeframe traders can look to buy the coin in the $93-$94.8 region, although a deeper dip to $91.4 was also possible.
The rejection at $102 did not faze Litecoin bulls
The four-hour chart showed LTC recovered and pushed back above the $94.7 resistance level. During the drop of 12 February, this level had been retested as resistance. When the price made a lower low and touched $88.4, the RSI made a higher low. This bullish divergence was followed by a sharp bounce in prices.
This bounce, combined with the OBV data, showed that Litecoin was likely ready to push above the $100-$106 resistance in the coming days. The OBV has been in a steady uptrend throughout February. Any pullbacks in the price were not reflected as sharply on the OBV. This meant selling pressure was negligible and genuine demand was persistent behind Litecoin.
To the north, a daily bearish order block lay in the $100-$106 region. It might not be broken immediately, and some consolidation just above $100 before an eventual breakout was a possibility. Since Bitcoin was also successful in its defense of $21.6k, LTC bulls can hope for further gains. Above $106, $115 was the next timeframe resistance level to watch.
Realistic or not, here’s LTC’s market cap in BTC’s terms
Funding rate slips into negative territory once more, but bullish intent was apparent

Source: Coinalyze
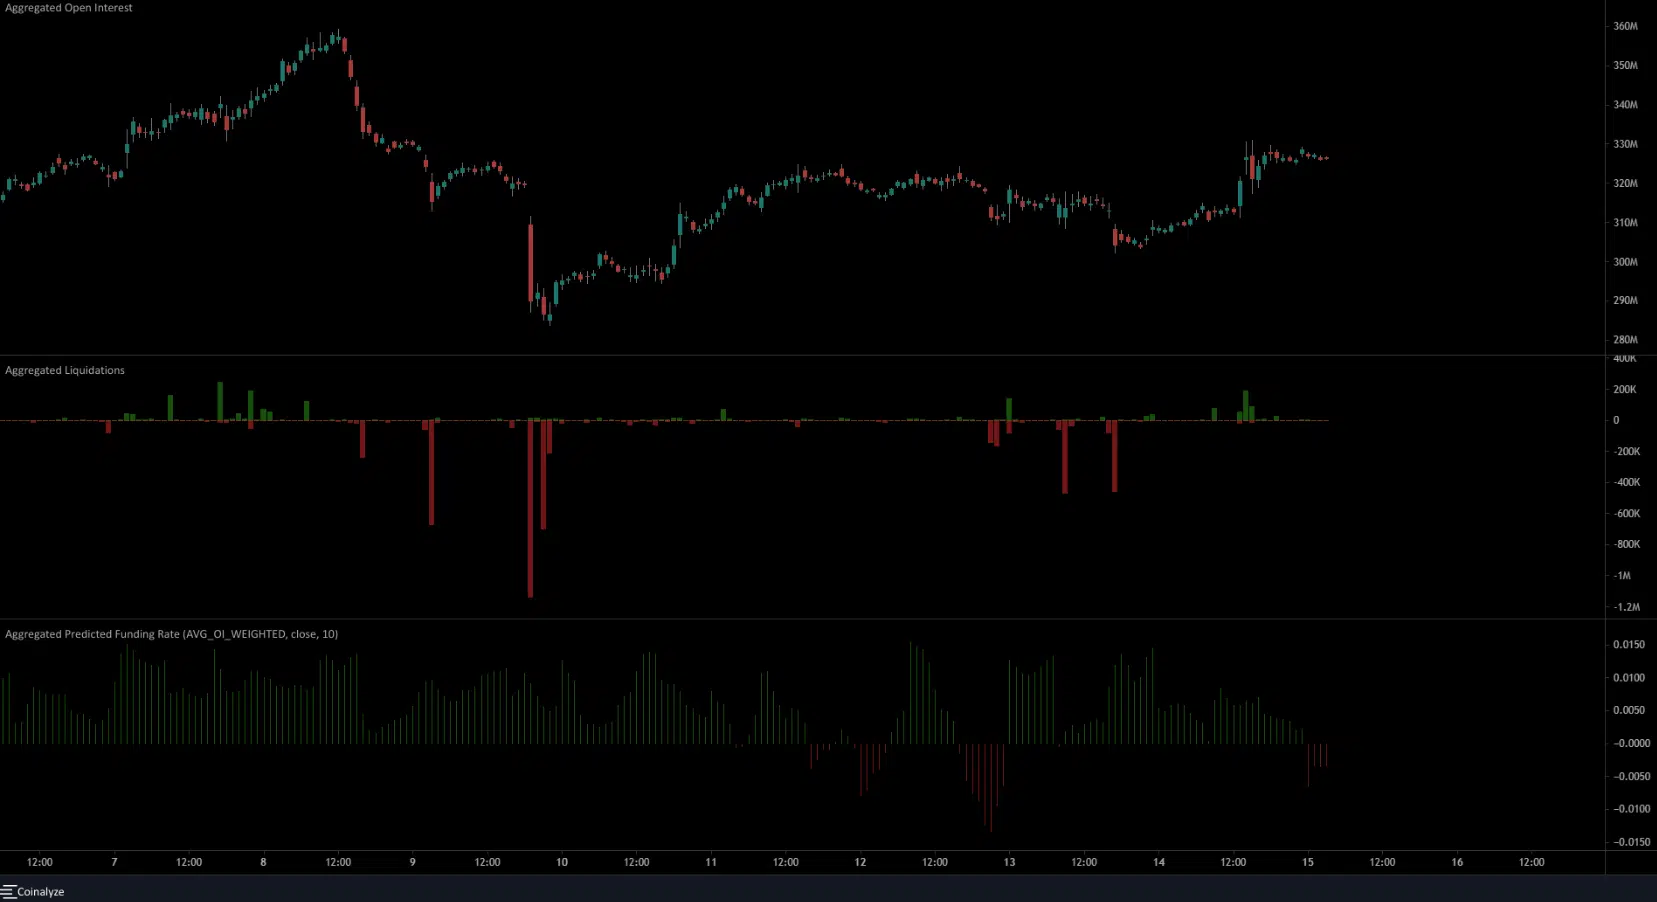
The predicted funding rate slipped below zero a few hours before press time, just as it had on 12 February. That day, LTC had faced rejection at $94.7. Did the metric indicate that another dump could be around the corner? The Open Interest showed bullish sentiment.
Alongside the prices, the OI has been on the rise, especially over the past couple of days. This showed sentiment remained bullish, and OI can be expected to rise further as LTC broke above $94.7. The liquidation data showed $310k worth of short positions liquidated within three hours on 14 February, when the price pushed past the $92.6 mark.


