Litecoin [LTC]: How traders can leverage these profitable outcomes

Disclaimer: The findings of the following analysis are the sole opinions of the writer and should not be considered investment advice.
The ongoing market-wide liquidations pulled Litecoin [LTC] toward its long-term support around the $42-zone. The drop below the $61-zone affirmed the strength of its month-long descending triangle on the 4-hour timeframe.
A potential close below the immediate support range could boost the chances of a $47-zone retest before any trend-committal move. At press time, LTC was trading at $53.03, up by 14.02% in the last 24 hours.
LTC 4-hour Chart
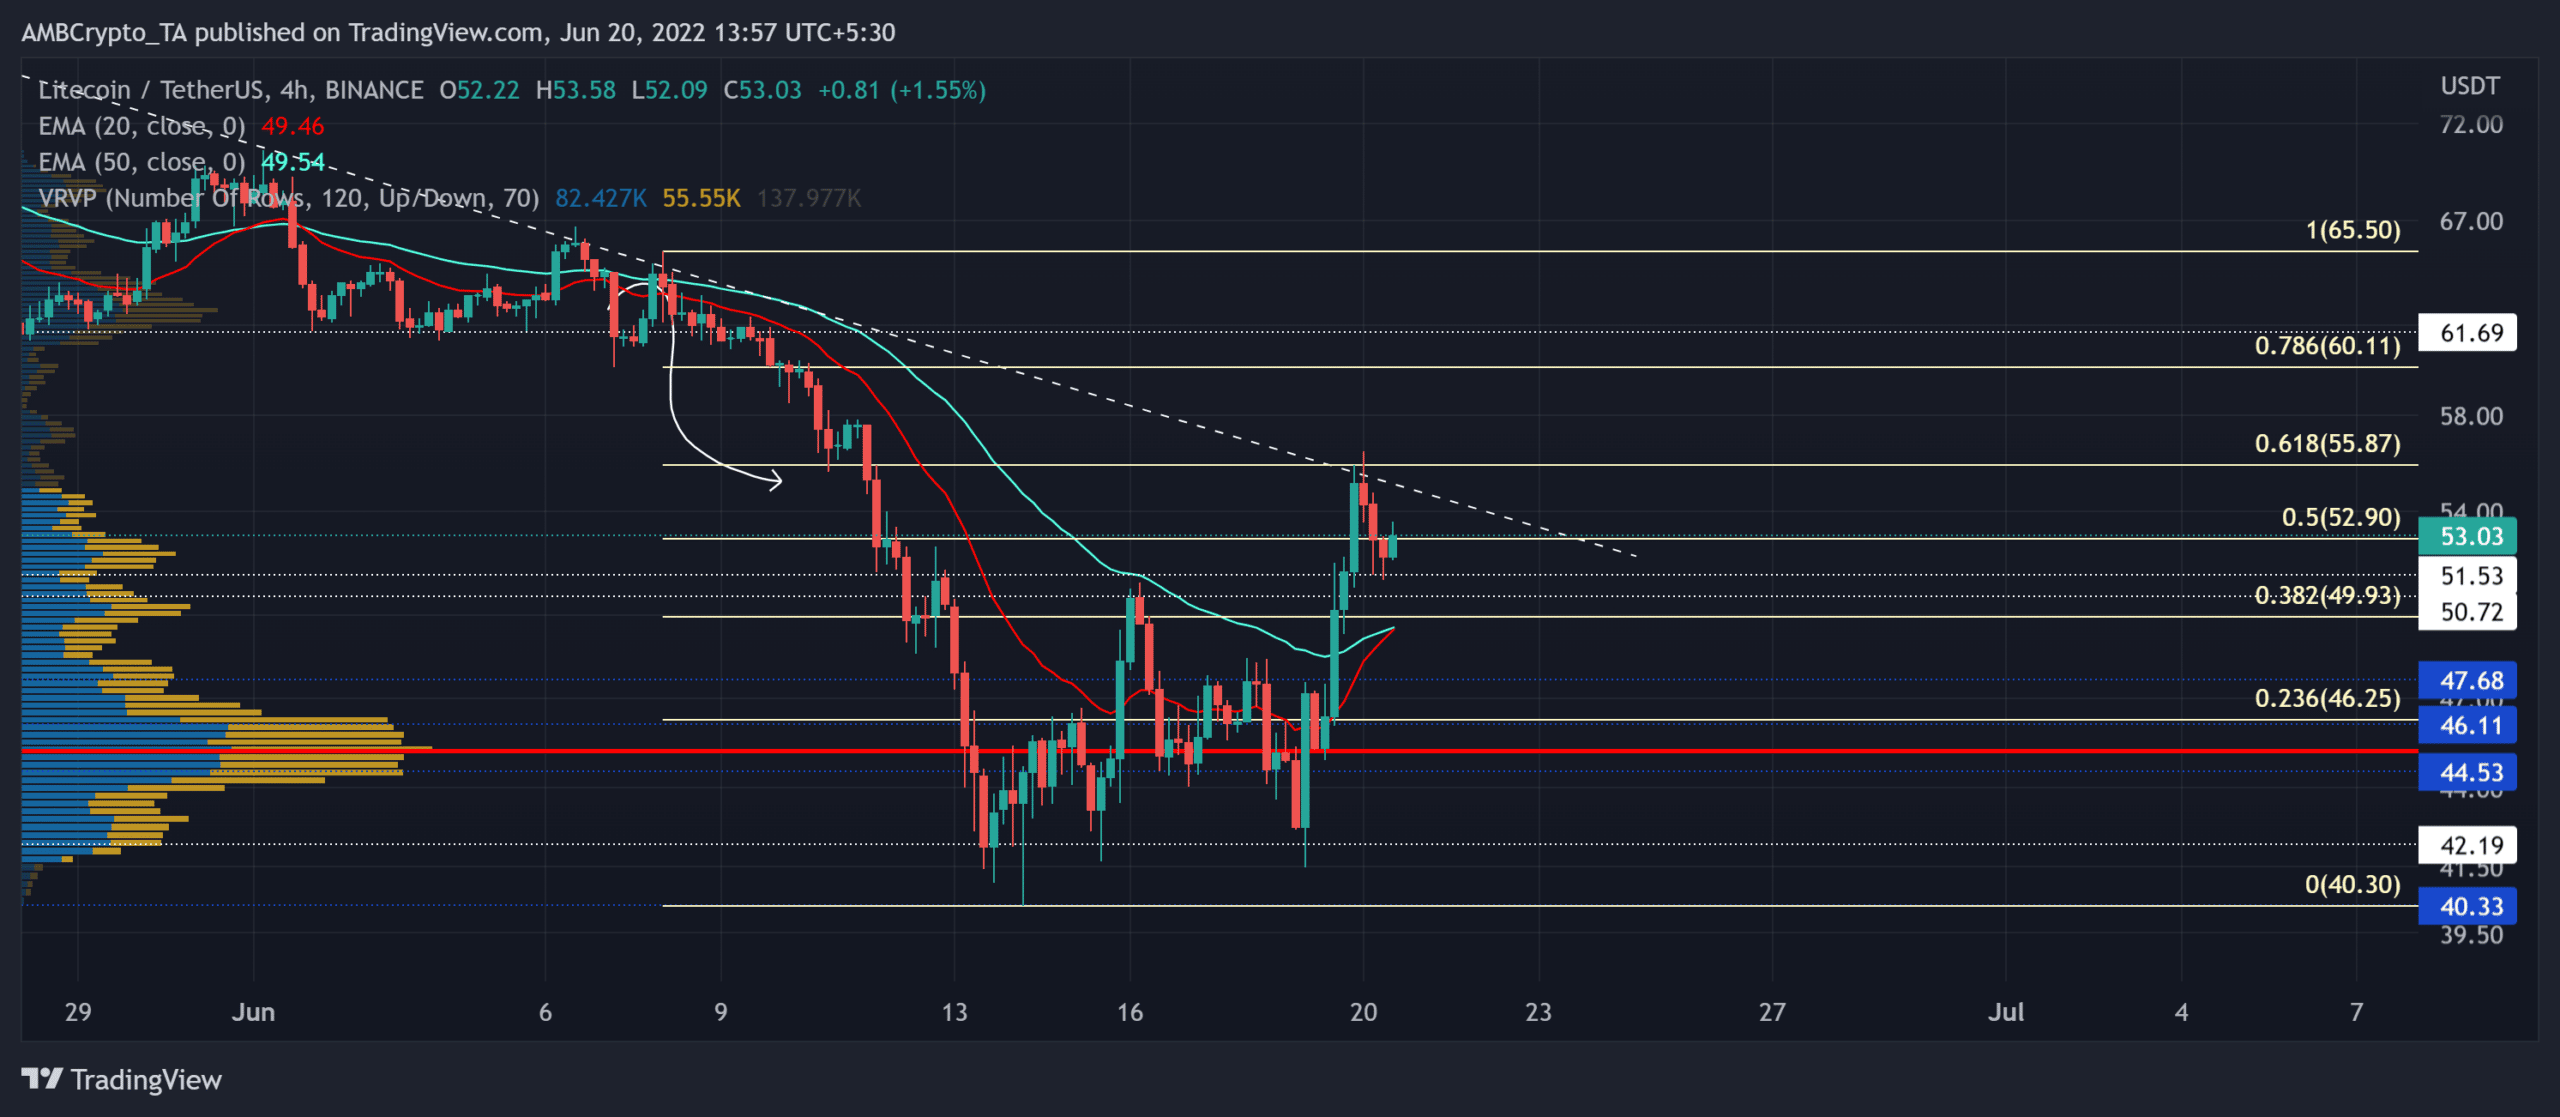
The altcoin’s heightened sell-off led it to test the $61-resistance multiple times over the last month. While the bears ensured the lower peaks, LTC saw an expected descending triangle breakdown towards its Point of Control (POC, red).
As a result, LTC plunged to touch its 23-month low on 14 June. After a brief compression phase, the 61.8% Fibonacci level coincided with the six-week trendline resistance (white, dashed) to pose a stiff hurdle. Thus, LTC displayed a strong rejection of higher prices around the $55.8-zone.
With the 20 EMA (red) finally looking north, a bullish crossover with the 50 EMA (cyan) can position the alt for a sustained near-term uptrend.
An immediate rebound from the $50-$51 range can help buyers retest the trendline resistance before a likely pullback. Any close below the 20/50 EMA could expose the alt for a fall towards the $44-$46 range near its POC.
Rationale

The Relative Strength Index (RSI) finally saw a reliable close beyond the midline on its northbound trajectory. Any close above the 61-level would help buyers maintain a near-term edge.
Also, the DMI lines exhibited a buying edge. But, the ADX [directional trend] stood substantially weak for LTC. Also, the bearish divergence on the CMF could aid the sellers in testing the $50-mark support on the chart.
Conclusion
Given the confluence of the 61.8%-level, trendline resistance, and a potential bearish divergence on the CMF, LTC could likely see a reversal from the $55-zone. A fall below the 20/50 EMA would trigger a shorting signal with targets as mentioned above.
However, LTC shares an 85% 30-day correlation with the king coin. A close eye on Bitcoin’s movement would be imperative to make a profitable move.


