Litecoin [LTC] struggles to break above $100, here’s why
![Litecoin [LTC] struggles to break above $100, here's why](https://ambcrypto.com/wp-content/uploads/2023/04/PP-3-cover-1-e1681386984298.jpeg)
Disclaimer: The information presented does not constitute financial, investment, trading, or other types of advice and is solely the writer’s opinion.
- Although the recovery from $65 saw large demand, it did not sustain into a breakout past $100.
- A retest of the $105 region could present short sellers with opportunities due to a higher timeframe resistance.
Litecoin has seen large volatility in 2023, but while many altcoins reversed their former downtrend, LTC remained stuck within a range. At the time of writing, it was trading just beneath the $100 zone of resistance.
How much are 1, 10, or 100 LTC worth today?
The recovery from the drop to $65 in mid-March was swift but the bulls have been rather timid in recent weeks. Bitcoin was strongly bullish, but if that were to change, Litecoin could be set to revisit the range lows.
Dormant LTC bulls were unable to push prices past $95
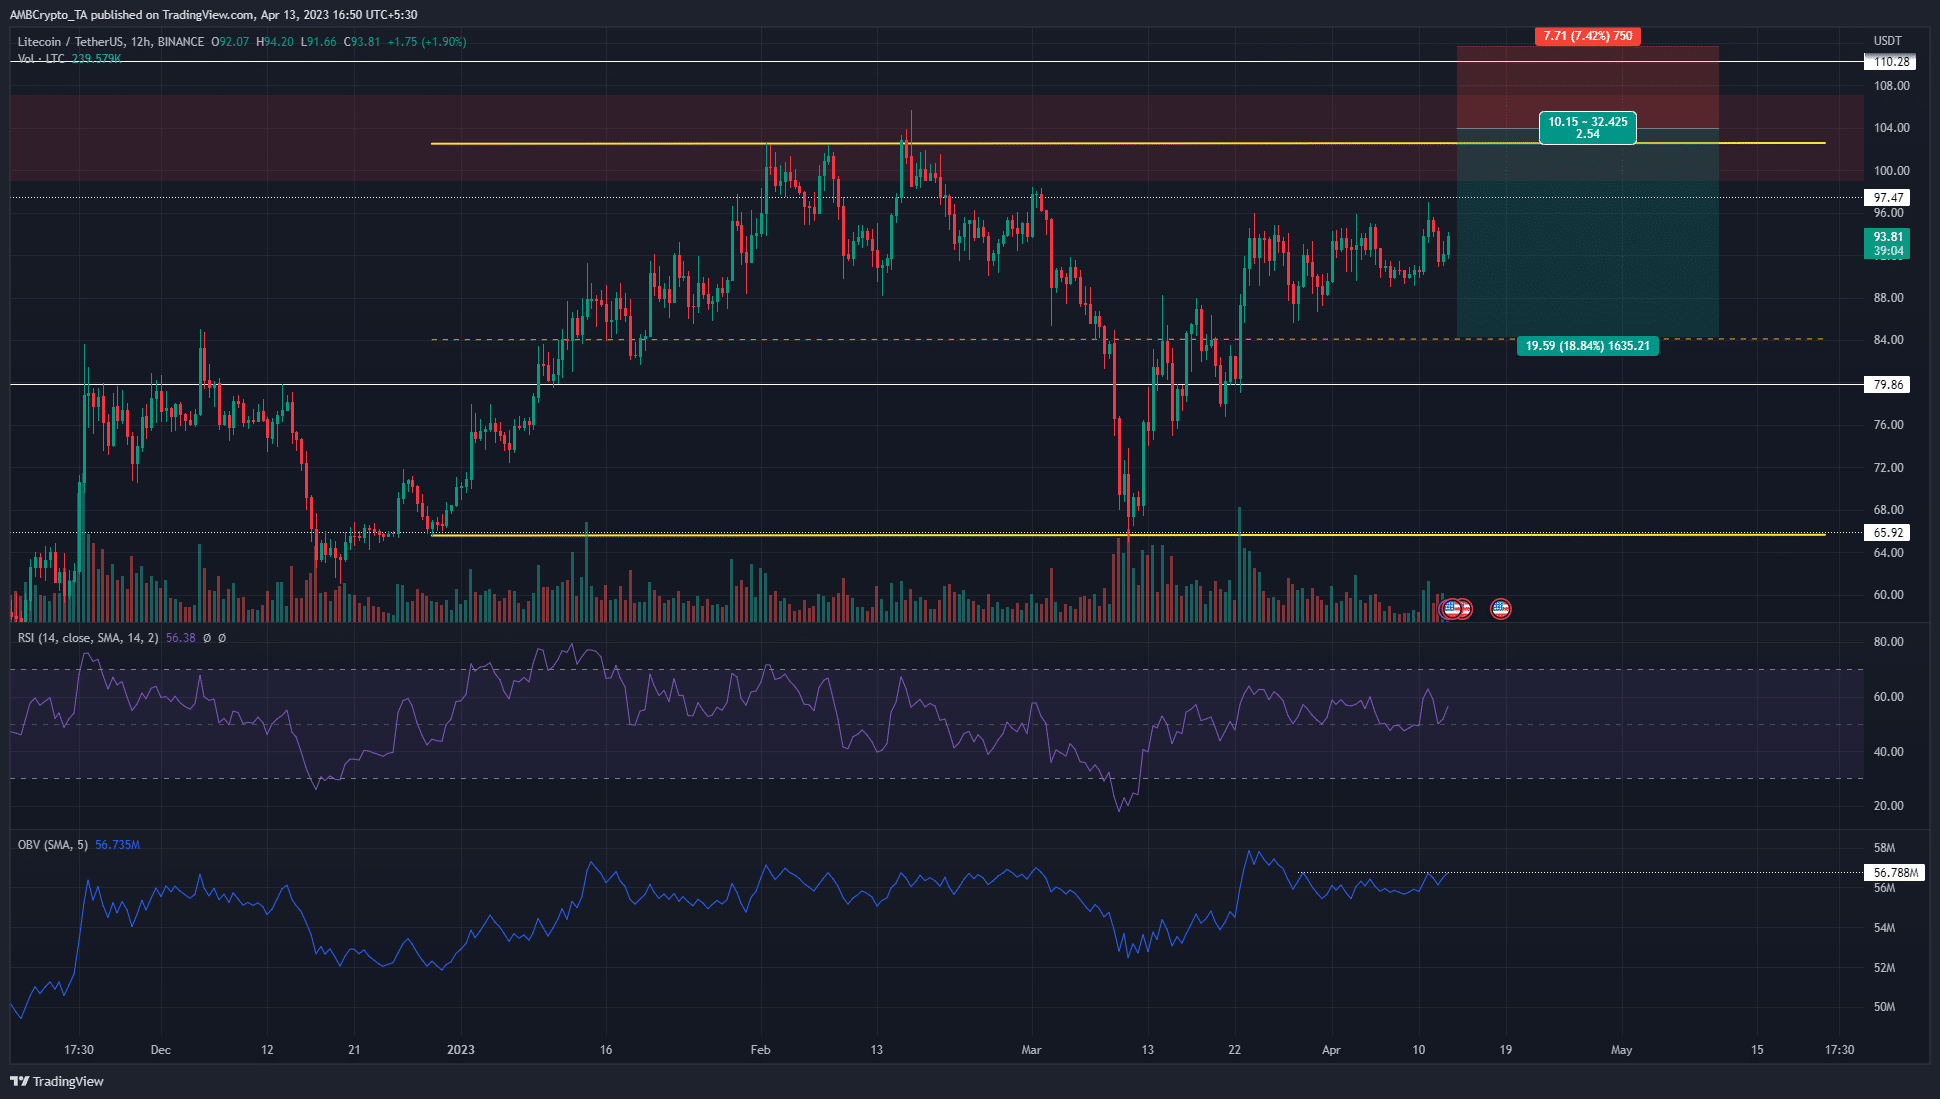
The red box at the $105 region highlighted a bearish order block on the daily timeframe. This was formed in May 2022, and Litecoin fell to $42 in June. In 2023, the price action was more hopeful but the bulls were not strong enough to effect a breach of $100.
The range (yellow) extended from $66 to $102.5, and the OBV remained within the range as well. It did not make a series of higher highs that spanned three months, which would have supported the idea of accumulation. Rather, it fell back to the 2023 lows during the mid-March sell-off.
Realistic or not, here’s LTC’s market cap in BTC’s terms
At the time of writing, the OBV was just beneath a recent local high, and the RSI saw a bounce from the neutral 50 mark as well. This showed neutral momentum and some buying pressure in the past month.
Therefore, aggressive traders can look to enter short positions in the event of an LTC rejection from the $100-$105 area. On the other hand, a strong move above the $108-$111 region will be indicative of a bullish impetus.
The futures market showed short-term bullishness

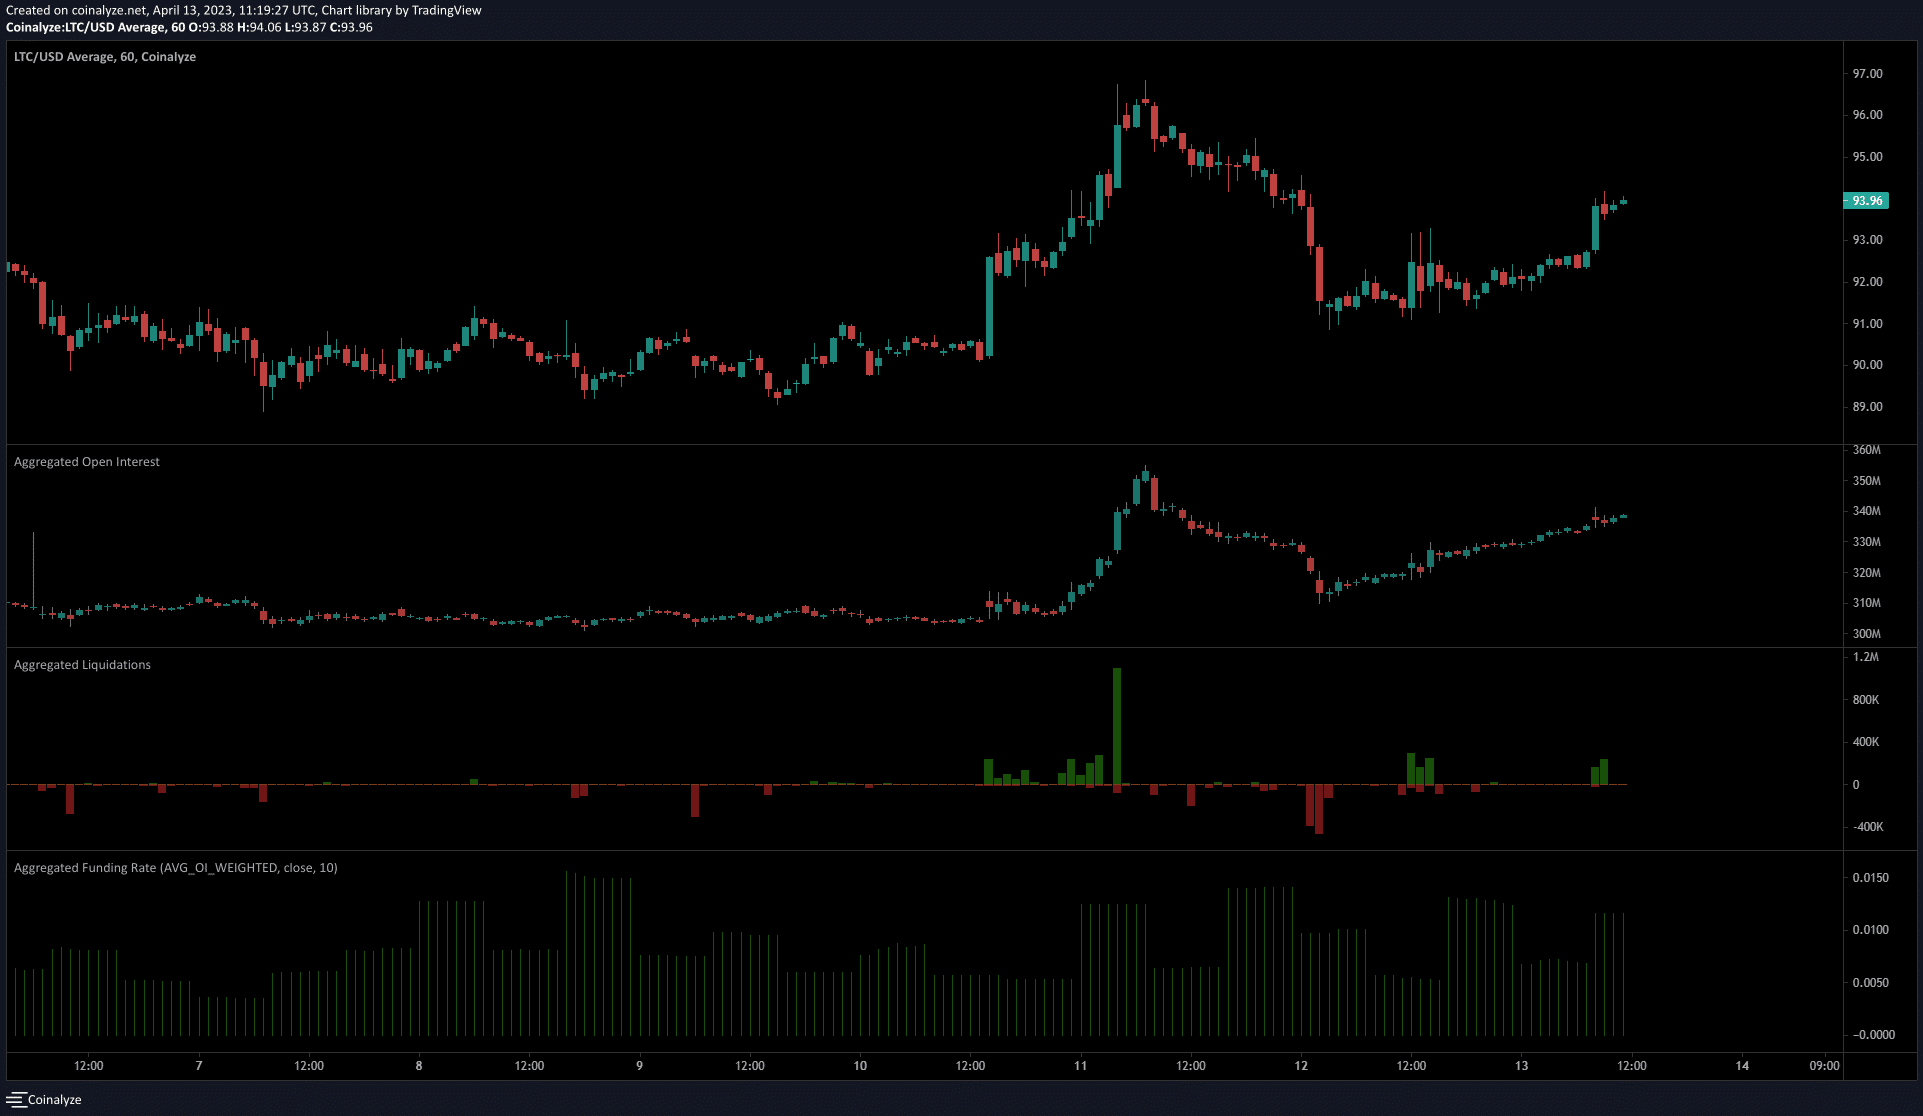
Source: Coinalyze
The 1-hour chart from Coinalyze was straightforward on the lower timeframes. The volatility of the past week saw some liquidations from both short and long position holders, but nothing significant.
The funding rate remained positive. Combined with the lower timeframe structure, the conclusion was a bullish sentiment.
More importantly, the OI has moved in tandem with the price action and advanced during LTC’s short-term rallies. This showed speculators were bullishly biased and willing to bet on price rallies rather than short the asset on price drops.


