Analysis
Litecoin Price Analysis: Cryptocurrency could swing higher as bulls take control
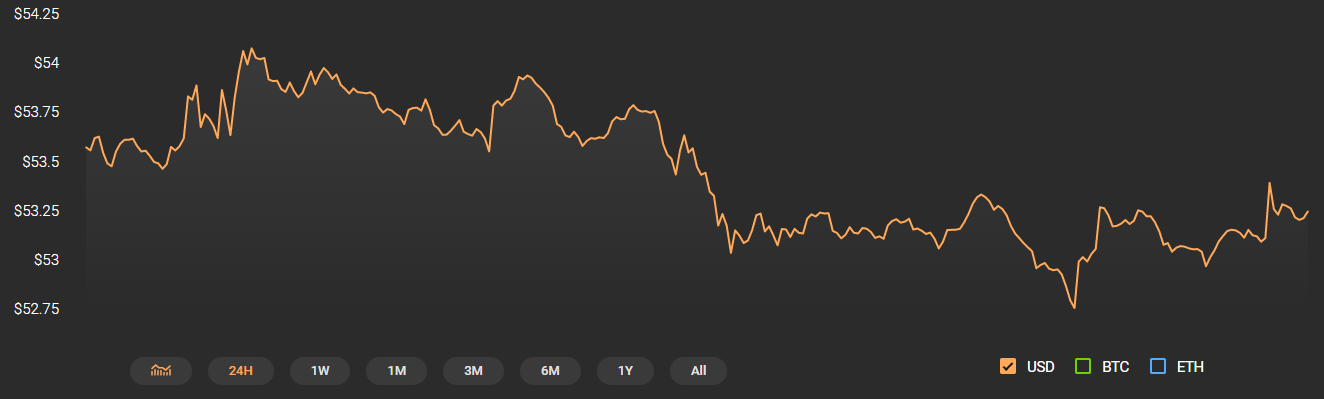
Litecoin [LTC] was trading at $53. 68 after rising by 0.12% in the last 24-hours, at press time. The silver coin held a market cap of $3.41 billion and registered a 24-hours trading volume of $2.4 billion, a significant portion of 11.8% was being traded at the crypto exchange CoinEgg via trading pair LTC/ETH followed by pair LTC/BTC which contributed 5.09%.

Source: CoinStats
LTC 1-hour Chart:

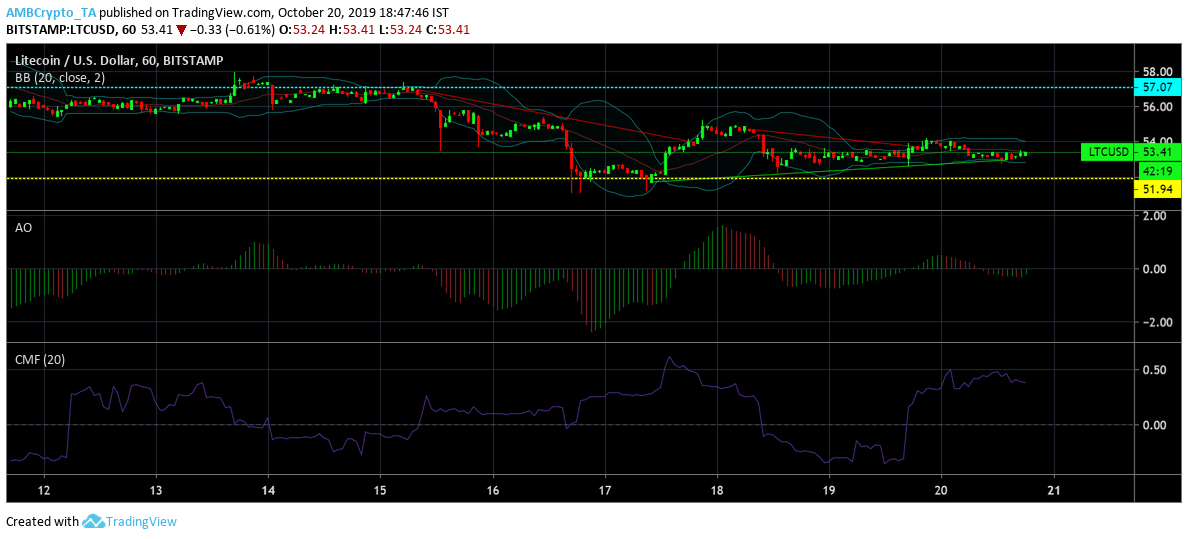
Source: LTC/USD on TradingView
Litecoin’s one-hour chart exhibited a downtrend from $56.95 to $54.02 and another minor downtrend was seen from $54.72 to $53.76. The cryptocurrency recorded an uptrend from $51.71 to $53.02. LTC found an immediate resistance point at $57.07 while the support stood firm at $51.94.
Bollinger Bands: The converging Bollinger Bands depicted low volatility in the LTC market.
Awesome Oscillator: The closing lines of the AO indicator was green, depicting a bullish period for the coin.
Chaikin Money Flow: The CMF line was well above the zero-line, indicating money flowing into the market and a bullish phase for the coin.
LTC 1-day chart:

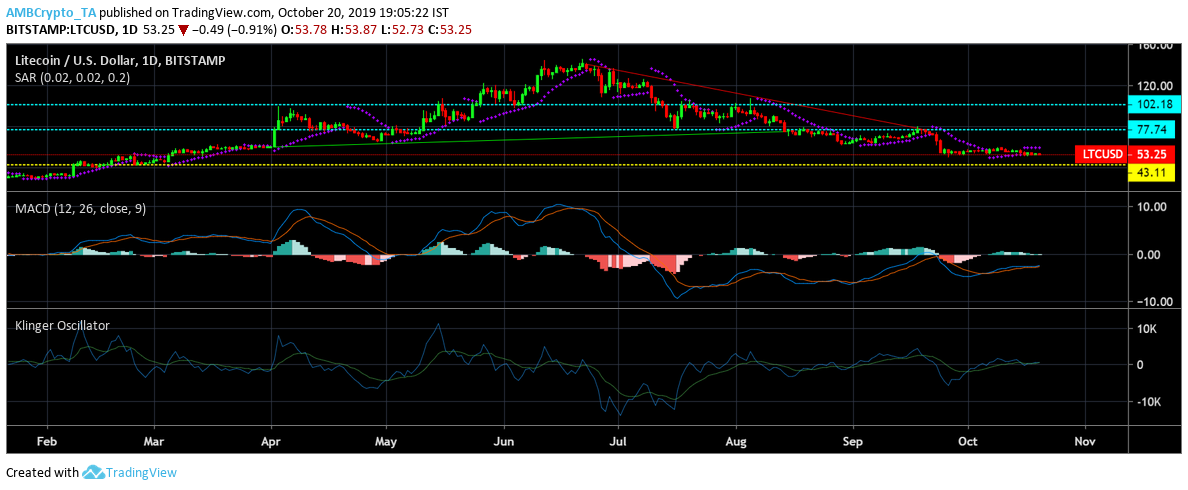
Source: LTC/USD on TradingView
Litecoin’s daily chart exhibited an uptrend from $60.82 to $75.28 and a downtrend from $141.11 to $77.43. The resistance point for the daily chart stood at points $77.74 and $102.18 respectively while the support remained untested at $43.11.
Parabolic SAR: The dotted markers hovering above the candlesticks depicted a bearish period for LTC.
MACD: The MACD line was above the signal line and suggested a bullish phase for the coin
Klinger Oscillator: The KO indicator also aligned with the bulls as signal line rested below the KO line.
Conclusion:
Despite subtle hints of bears presence, both short-term as well long-term price charts indicated a bullish phase for the coin in the near-term.


![Dogecoin [DOGE] continues decline, but will THIS turn things around?](https://ambcrypto.com/wp-content/uploads/2024/05/Dogecoin_accumulation-1-400x240.webp)