

Bitcoin leverage hits 5-year high – How ONE move could trigger pullback
Analysis
Litecoin price prediction shows a trend reversal is in the works
The small uptick in spot buying was an early signal that the buyers were trickling into the market.


- Litecoin has trended downward in the past ten days after a spike to $77.
- A move toward $60 appeared likely based on the price action and the mid-range resistance.
Litecoin [LTC] has a bearish market structure on the one-day chart. Moreover, it slipped below the $67.38 mark and was retesting the same as resistance at press time. To the north, $70.5 was another resistance level.
The technical indicators did not support a bullish bias yet. The buying pressure was not sufficient to boost Litecoin past the key resistance levels to the north. However, a short-term shift was beginning.
The rangebound price action
Since November, LTC has struggled to break above the $77-$79.5 resistance zone. In early January it dropped as low as $57.71, retesting 11th September’s low almost perfectly. At press time the mid-range mark served as a strong resistance.
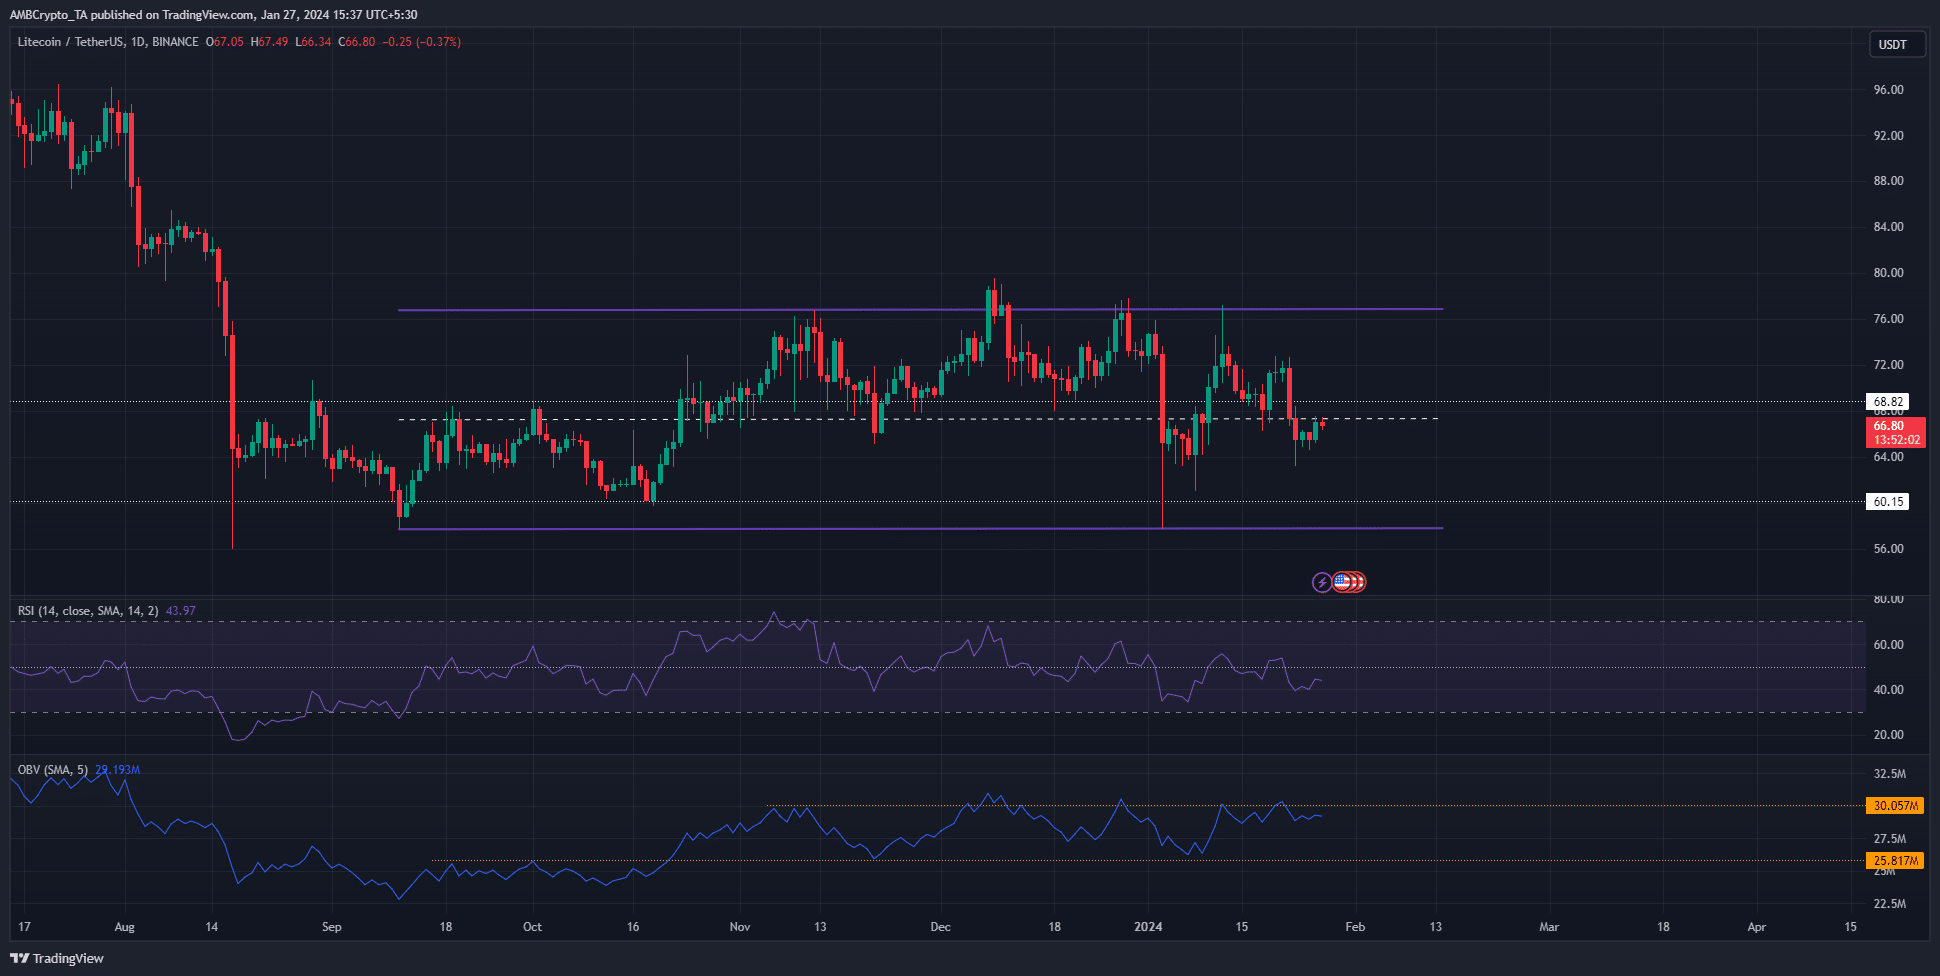
Alongside the price, the OBV has also been stuck within a range. Meanwhile, the RSI reflected bearish momentum alongside the market structure. Climbing above $72.7 would flip the market structure in the opposite direction.
Hence, a bearish bias was warranted. A move to the $63.19 and $61 lows could occur as the price falls to the next liquidity pool.
The demand for Litecoin has increased marginally
While the higher timeframe OBV showed it was stuck within a range and saw a dip in the past week, the spot CVD saw a minor uptick in the past three days.
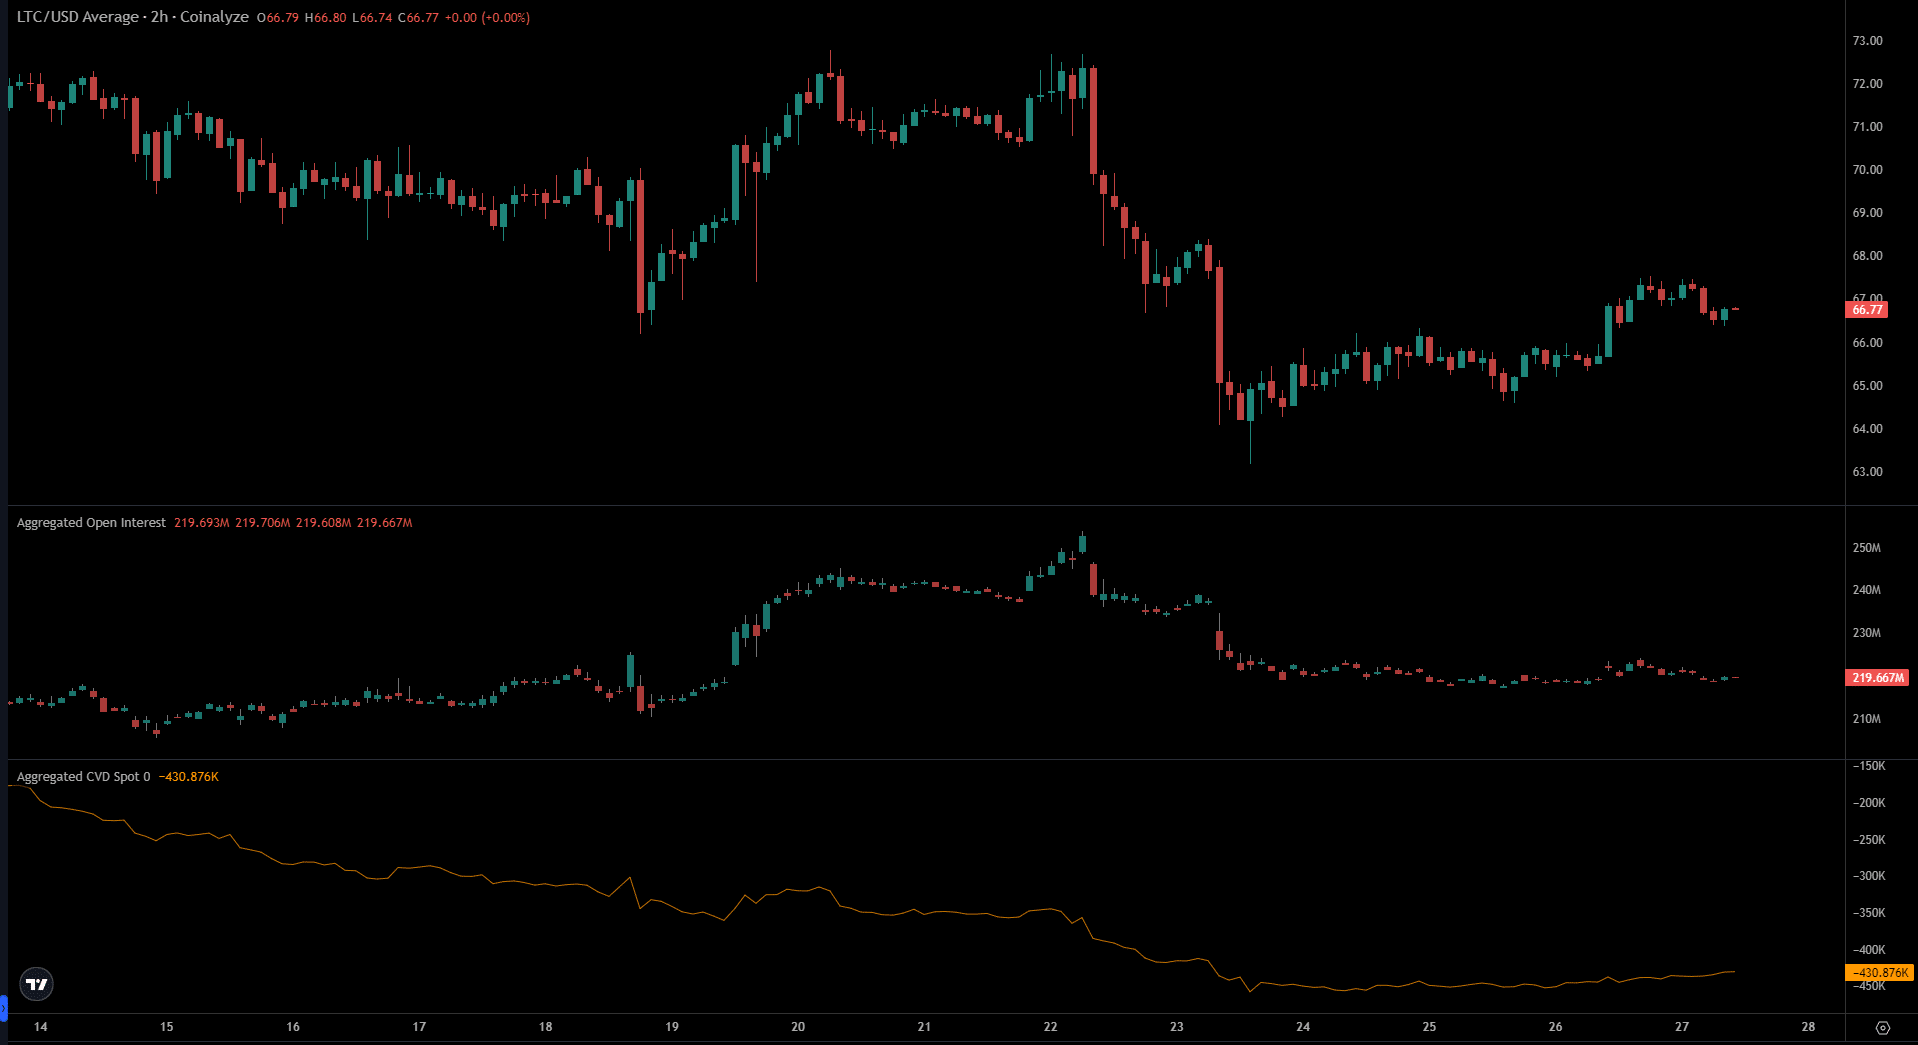
Source: Coinalyze
The Open Interest has stayed flat over the past three days while Litecoin climbed slightly from $64 to $66.7. This was a nearly 4% move higher, but the sentiment was still lukewarm.
Is your portfolio green? Check the LTC Profit Calculator
Neither the spot buyers nor the futures traders were strong enough to force a reversal for Litecoin.
Yet the small uptick in spot buying was an early signal that the buyers were trickling into the market.
Disclaimer: The information presented does not constitute financial, investment, trading, or other types of advice and is solely the writer’s opinion.


