Litecoin rejected from range highs, when will selling pressure cool off
On both the daily timeframe and the 4-hour price chart of Litecoin, there was a fair value gap in the $95-$97 region.

Disclaimer: The information presented does not constitute financial, investment, trading, or other types of advice and is solely the writer’s opinion.
- A sharp plunge from $100 flipped the market structure to bearish.
- The support zone of around $82 was respected.
The daily bearish order block at the $104 zone from May 2022 remained unbroken. Litecoin formed a range in recent months that extended from $65 to $102. The bulls faced another wave of selling at the range highs last week.
How much are 1, 10, or 100 LTC worth today?
Bitcoin saw a bounce from the $27k area in the past two days but the king’s momentum was bearish on the daily timeframe. LTC also exhibited bearish momentum, so the bears looked poised to take control soon. But where?
The $97 resistance had confluence with a daily imbalance
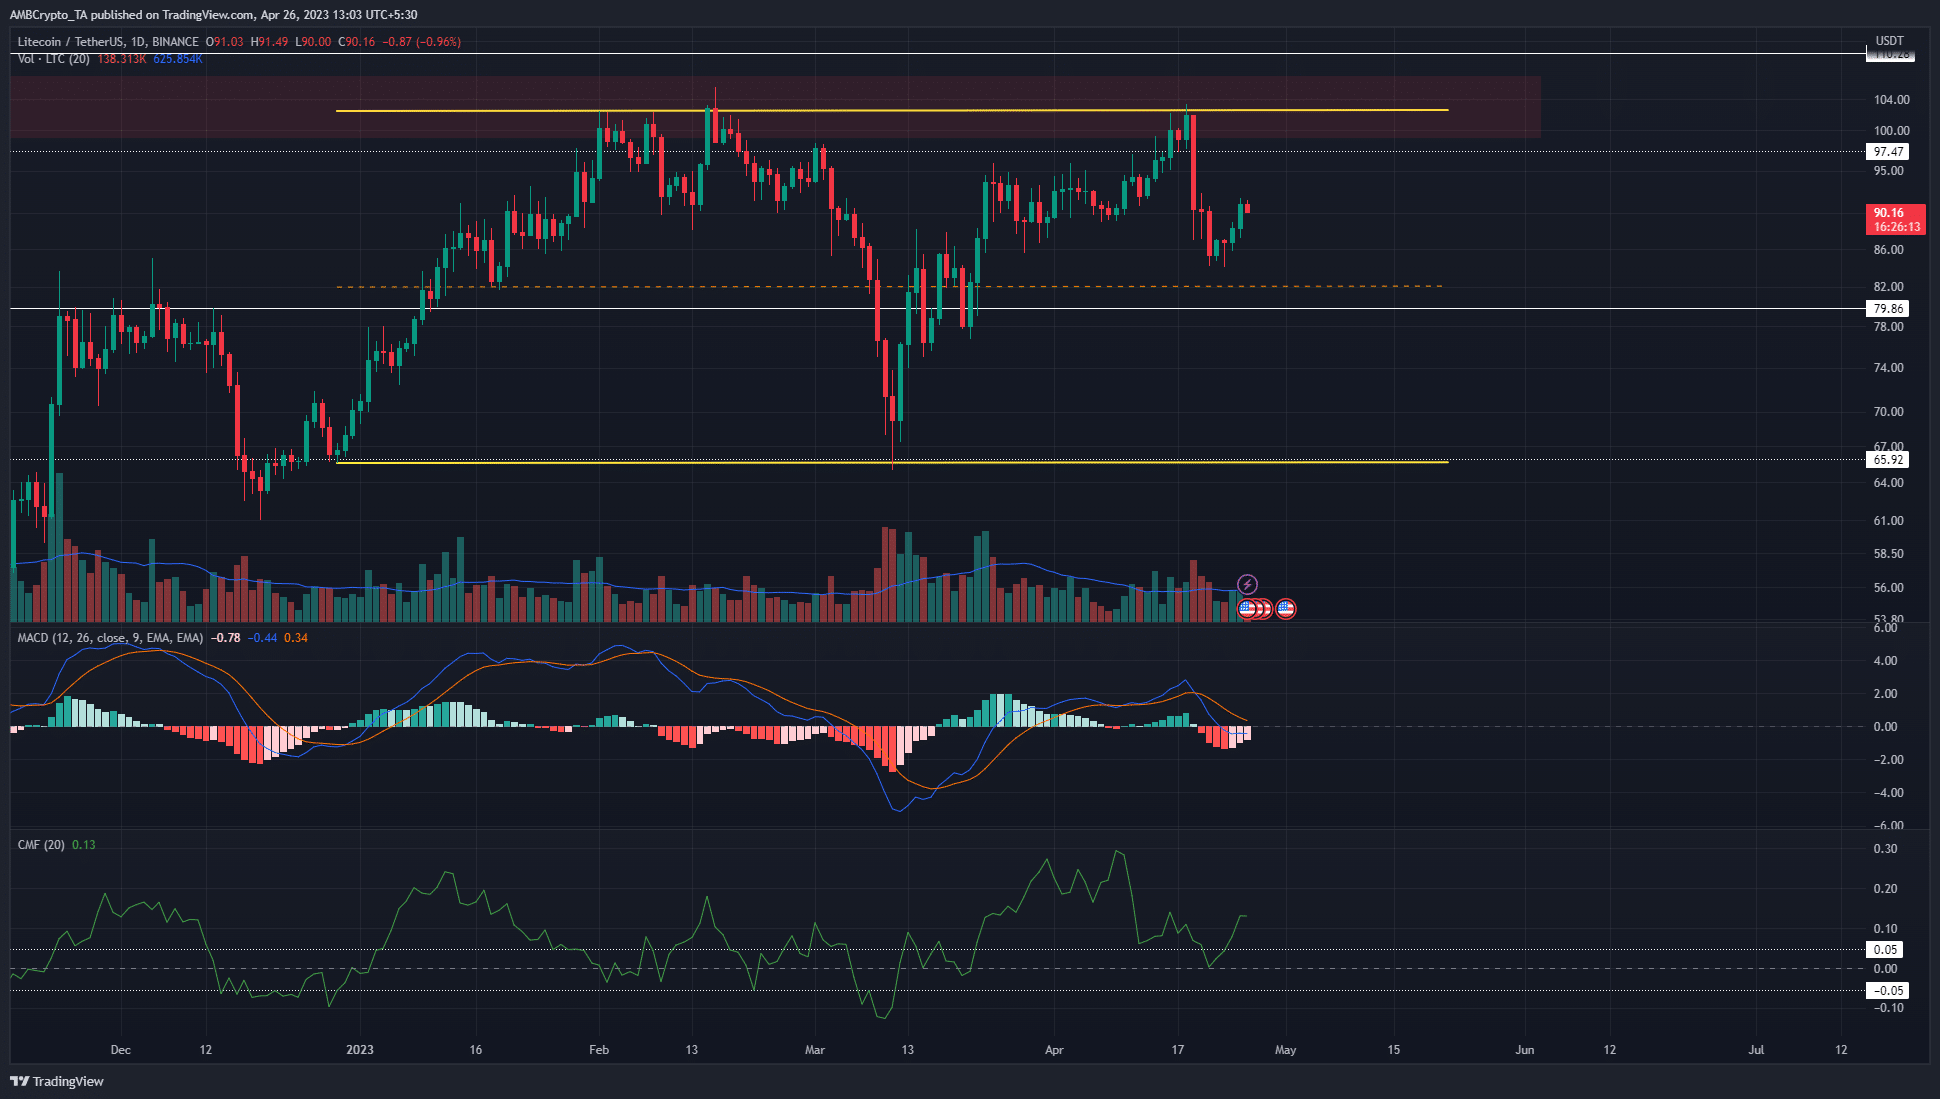
On the lower timeframes such as the 4-hour, Litecoin still had a bearish market structure. On both the daily timeframe and the 4-hour chart, there was a fair value gap in the $95-$97 region. From 24 March to 12 April, the $94.4 level acted as stern resistance.
The confluence of the fair value gap on the daily timeframe at $97 had confluence with the $97.47 resistance on the charts. Therefore, LTC could bounce to the $95-$97 region before the sellers flood the market again.
Realistic or not, here’s LTC’s market cap in BTC terms
The MACD showed bearish momentum and formed a bearish crossover on 20 April, following the rejection at $102. The CMF was defiantly above +0.05 to show strong capital inflow into the market.
This showed that some more gains were a possibility, yet the price action of LTC showed bears were likely to force LTC on another leg downward.
The CVD saw a bounce in the past 24 hours but sentiment favored the sellers
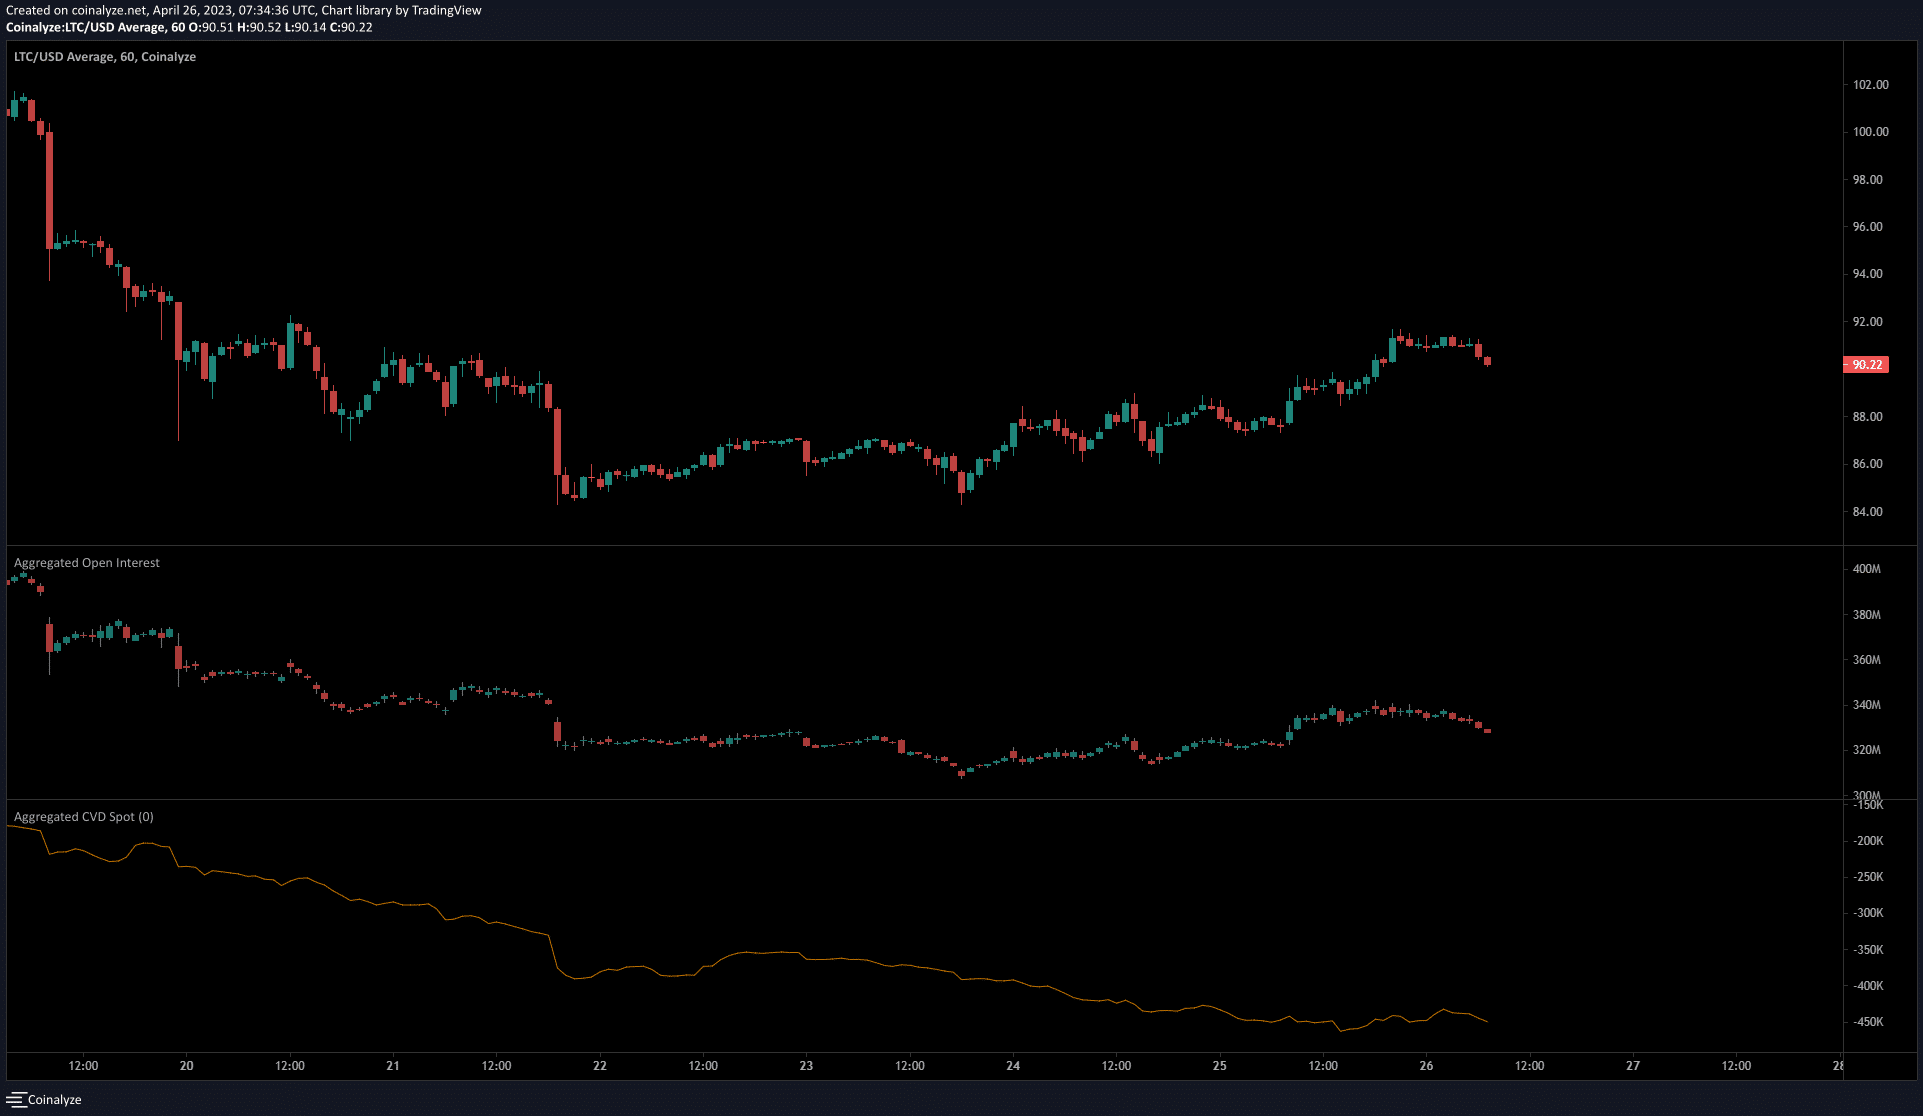
The 1-hour Coinalyze data presented above was in agreement with the findings from the higher timeframe price action. The OI saw a meek rise since 24 April, when LTC bounced from the $84 level. However, the gains on the OI were in the process of being wiped out in recent hours.
This signaled discouraged bulls and bearish sentiment in the market. The spot CVD, on the other hand, began to climb upward on 25 April.
If the buyers can maintain this pressure, it was possible that LTC could witness another bounce. However, short-term bullish traders need to be cautious as the market has flipped bearish.
![Aerodrome [AERO] had its moment](https://ambcrypto.com/wp-content/uploads/2026/06/Abdul-2026-06-22T084432.364-e1782114380197.webp)