Litecoin sellers hunt for selling opportunities after this bearish retest

Disclaimer: The information presented does not constitute financial, investment, trading, or other types of advice and is solely the writer’s opinion.
- Litecoin has trended upward since October 2022.
- Price action developments since mid-February showed bears had the upper hand.
In late November of 2022, while the rest of the crypto market faced wave after wave of intense selling pressure, Litecoin began to trend upward.
Its strength carried on into the new year. The rally across the market in January saw LTC climb from $70 at that time to reach $100 in early February.
Realistic or not, here’s LTC’s market cap in BTC’s terms
Litecoin also had strongly positive interactions on social media which outlined its short-term bullish sentiment. This helped propel the coin from $80 to $95.7, but analysis showed the sellers could regain control once more.
The rejection at $104 was the beginning of a flip toward bearish strength
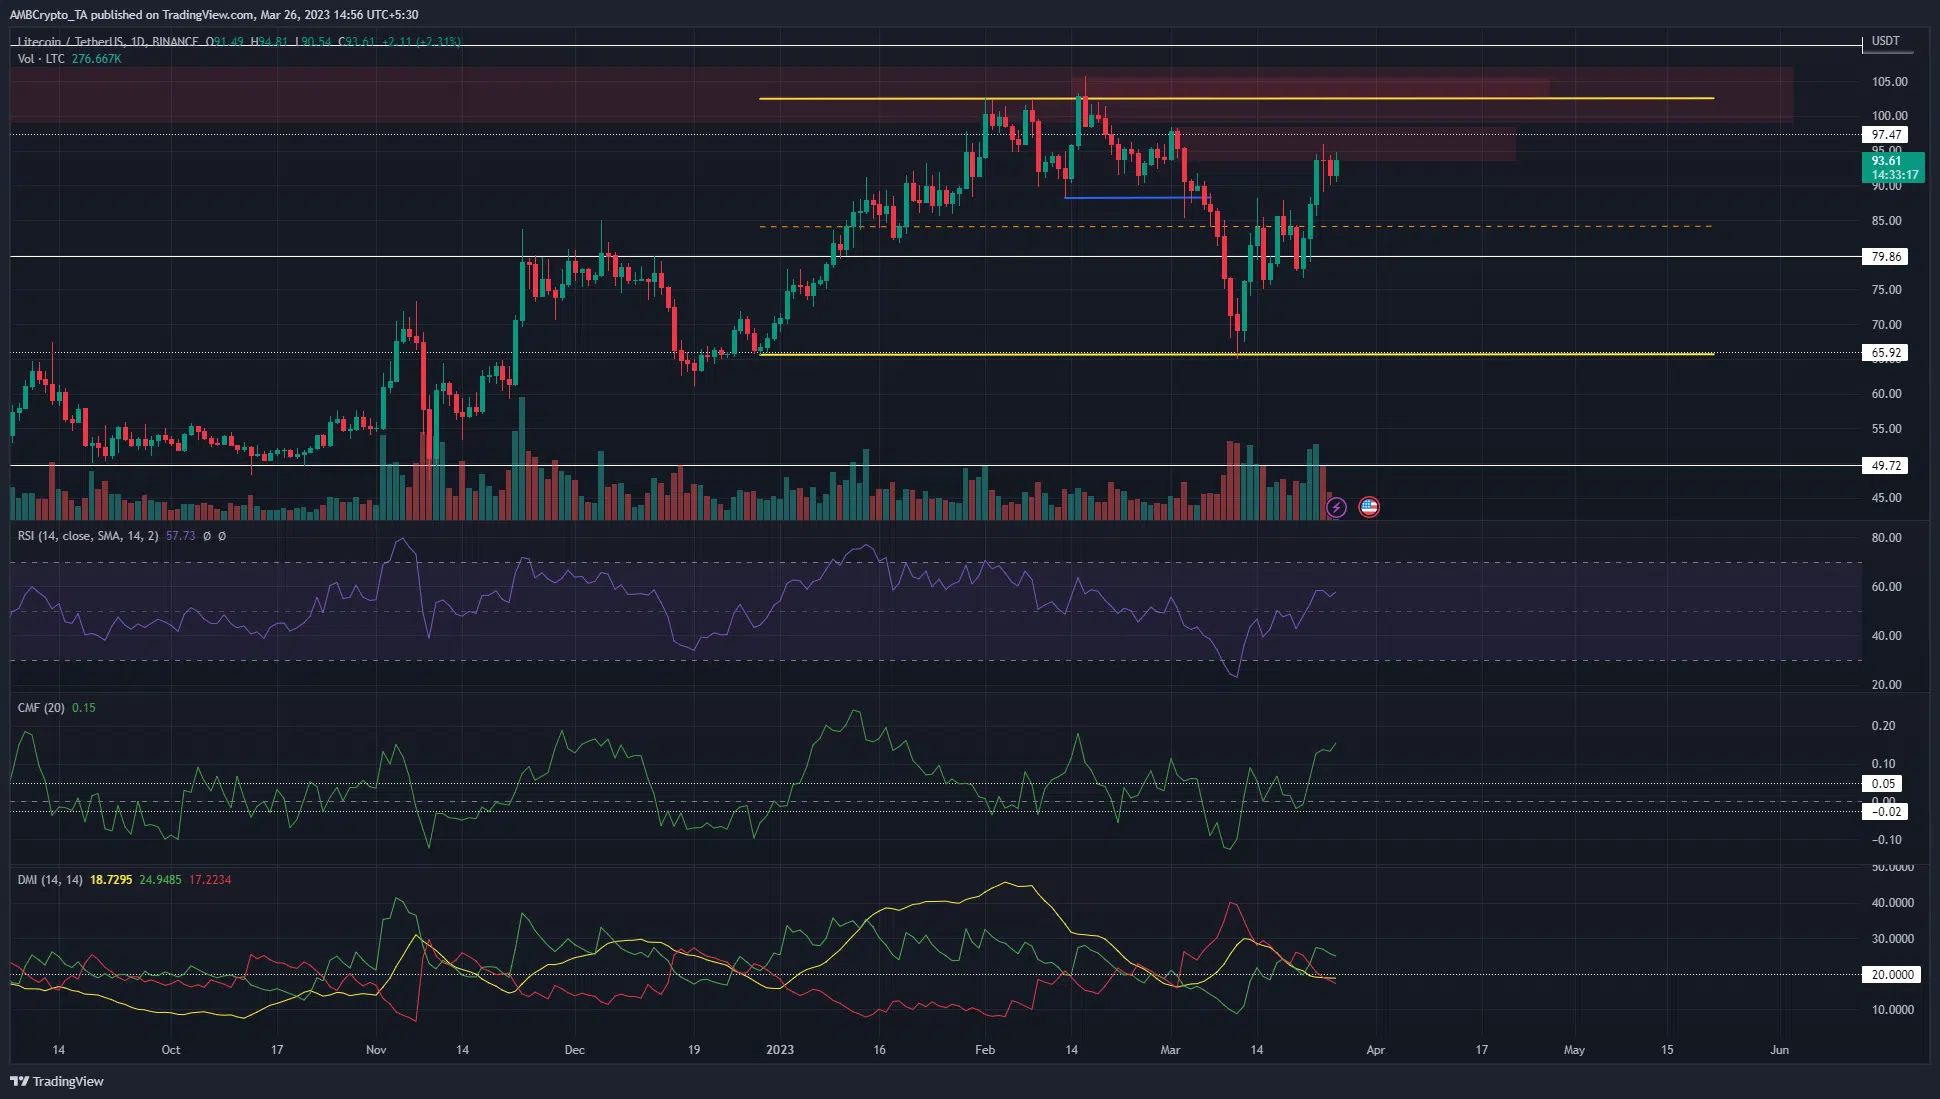
The uptrend of LTC was broken when the series of higher lows were breached on 6 March, shown by the blue line. Thereafter, Litecoin proceeded to shed another 27% on the price charts to reach the $65.9 support once again.
The bullish reaction at this level showed that the coin traded within a range that extended from $65.9 to $102.4. The $104 region presented a bearish order block from May 2022 that has not yet been broken.
The indicators showed some positive sentiment on the daily timeframe LTC chart. The RSI rose above neutral 50 to signal bullish momentum, while the CMF stood at +0.15 to highlight strong capital flow into the market.
Is your portfolio green? Check the Litecoin Profit Calculator
These factors underlined strong buying pressure in recent days. The Directional Movement Index did not show a solid trend in progress as the ADX (yellow) was below 20.
The resistance at $96 and $104 has been extremely strong, and a retest of the red boxes on the charts could see an LTC rejection.
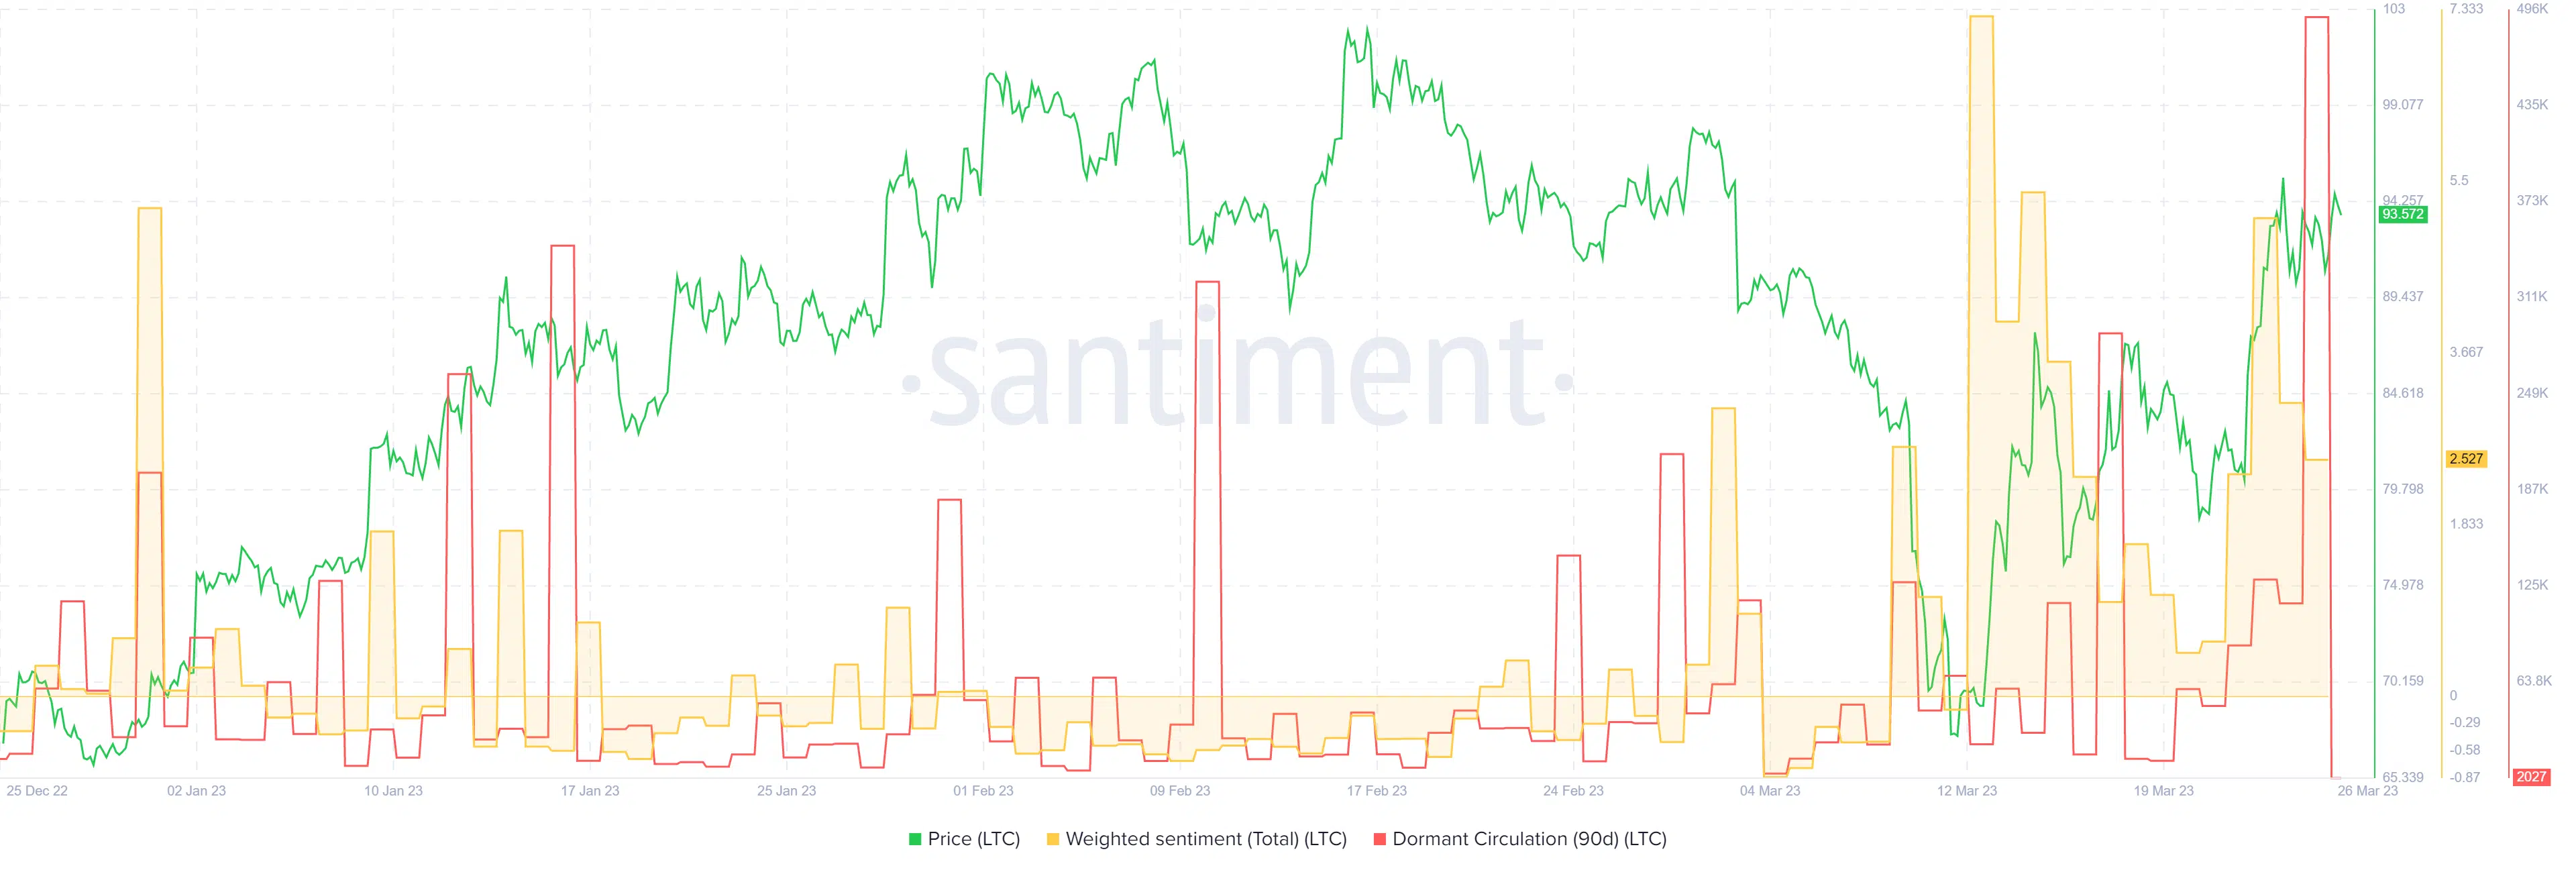
On-chain metrics showed large coin movement

Source: Santiment
As highlighted before, the weighted sentiment metric showed a large peak on 22 March. This was when the short-term rally from $79 began. When the prices reached the bearish order block at $94 over the past couple of days, things began to change.
The 90-day dormant circulation saw a huge spike that measured 492k LTC moved. This likely signaled a strong wave of selling right around the corner, which could send Litecoin to $80 and even to the range lows at $66.


