Analysis
Litecoin slumps further in the charts as bears continue assault
After rapid growth during the bull run of April-June, Litecoin’s price had been a progressive slump over the last couple of months. At press time, another bearish run took its valuation down to $64.36. The market capitalization was recorded to be $4.06 billion and the silver coin suffered a decline of 1.33 percent over the past day. The trade volume was around $2.8 billion in the 24-hours.
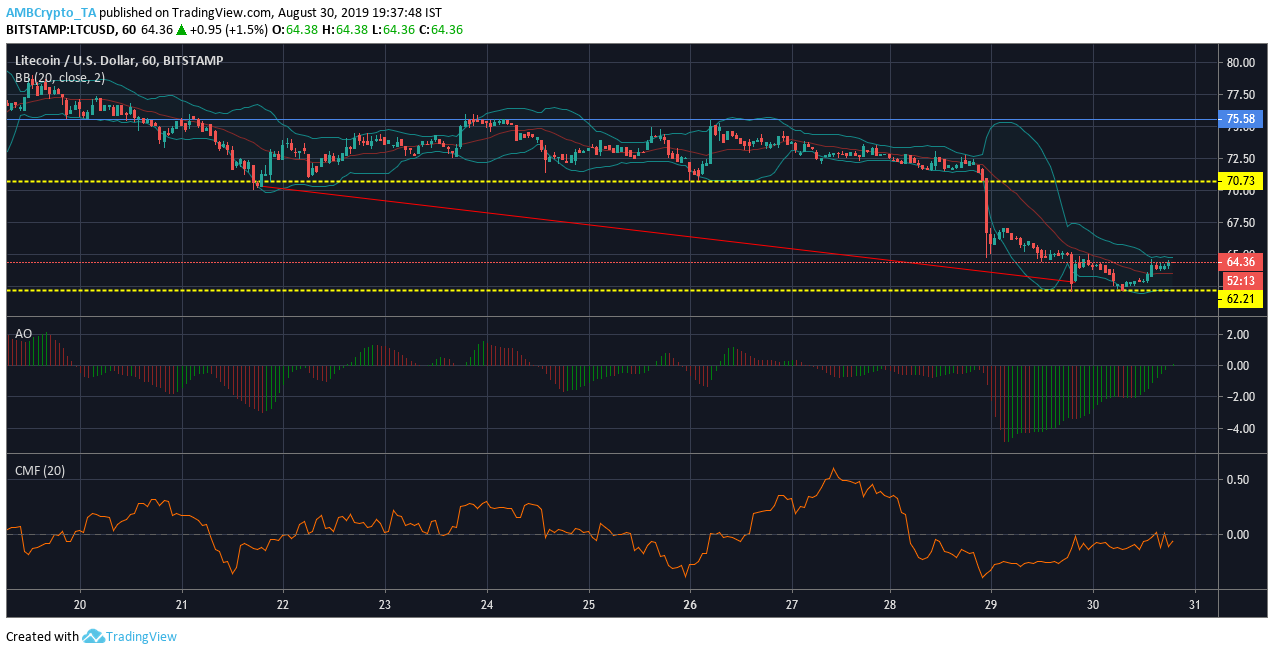
1-hour chart

Source: Trading View
Resistance 1: $75.58
Support 1: $70.73
Support 2: $62.21
The short term analysis of Litecoin projected a flash fall on 28th August which breached Support 1 and the valuation was currently navigating under the $70 mark. A major downtrend was observed which stretched the valuation from $70.35 to $62.78.
The Bollinger Bands appeared to diverge in the charts which suggested increasing volatility for the coin.
The Awesome Oscillator or AO was bullish in nature but the momentum was very weak.
The Chaikin Money Flow or CMF was below the zero-line which indicated a decrease in capital flow in the market.
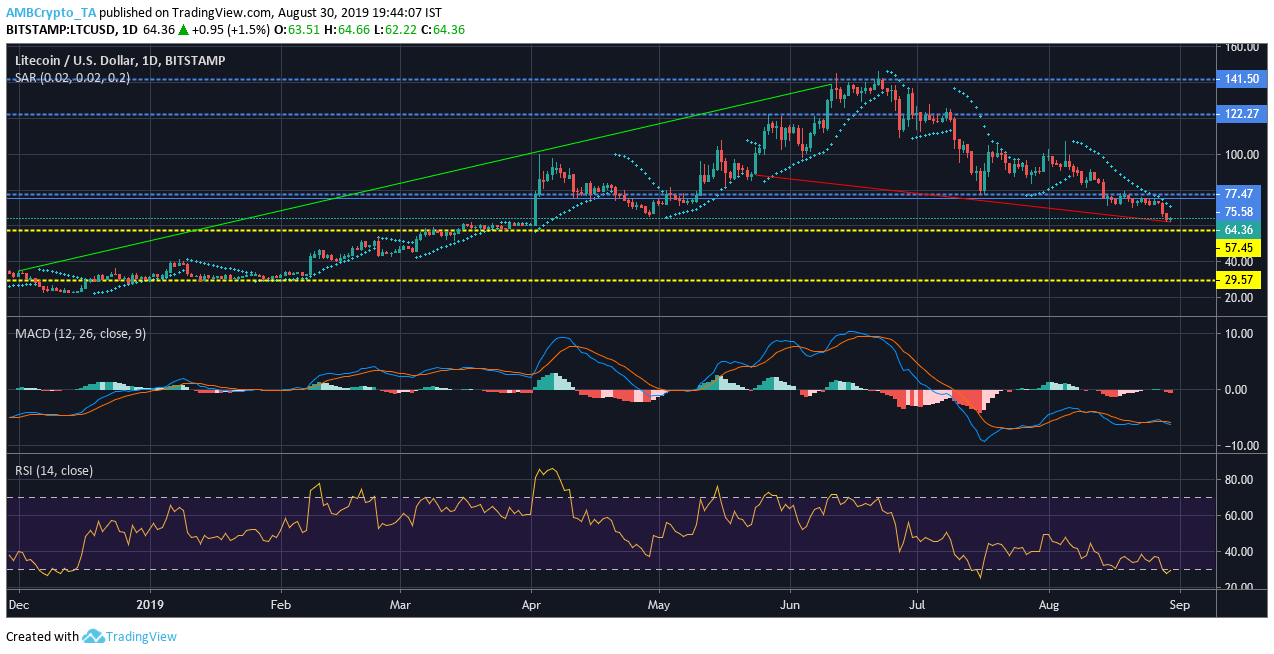
1-day chart
Source: Trading View
Resistance 1: $141.50
Resistance 2: $122.27
Resistance 3: $77.47
Support 1: $57.45
Support 2: $29.57
The long-term chart indicated progressive depletion of LTC’s price which saw the valuation dropped from $88.13 to $61.76. The major uptrend occurred during the bull run which saw the valuation rise from $34.29 to $13.64.
The Parabolic SAR was bearish in the charts as the dotted markers appeared above the candlesticks.
The MACD line and the signal line completed a bearish trend after the red line was seen over the blue line.
The Relative Strength Index or RSI indicator suggested that Bitcoin was over-sold at press time.
Conclusion
Litecoin has been quite in the market as the short term charts and the long term charts indicated a stagnant phase.


![Dogecoin [DOGE] continues decline, but will THIS turn things around?](https://ambcrypto.com/wp-content/uploads/2024/05/Dogecoin_accumulation-1-400x240.webp)