Litecoin, Synthetix, VeChain Price Analysis: 10 February

Litecoin was not too far away from the $200-level, with LTC projected to surge above that mark over the next few trading sessions. Further down the crypto-ladder, Synthetix and VeChain underlined the strength in the broader market as the altcoins traded at record levels, at press time. However, there were chances of a bearish pullback according to some indicators.
Litecoin [LTC]

Source: LTC/USD, TradingView
A surge of over 12% in the last 24 hours saw Litecoin flip key resistance levels as the cryptocurrency closed in on the $200-mark. The On Balance Volume made higher highs and highlighted the buying pressure in the market. An extended bull run could see LTC challenge the next resistance level at $205.
There was the possibility of a bearish pullback on the charts as the Relative Strength Index traded in the overbought zone, an area of reversal. Considering the recent bullishness in the market, however, a fall below $172.3 was not likely even in a bearish scenario.
Synthetix [SNX]

Source: SNX/USD, TradingView
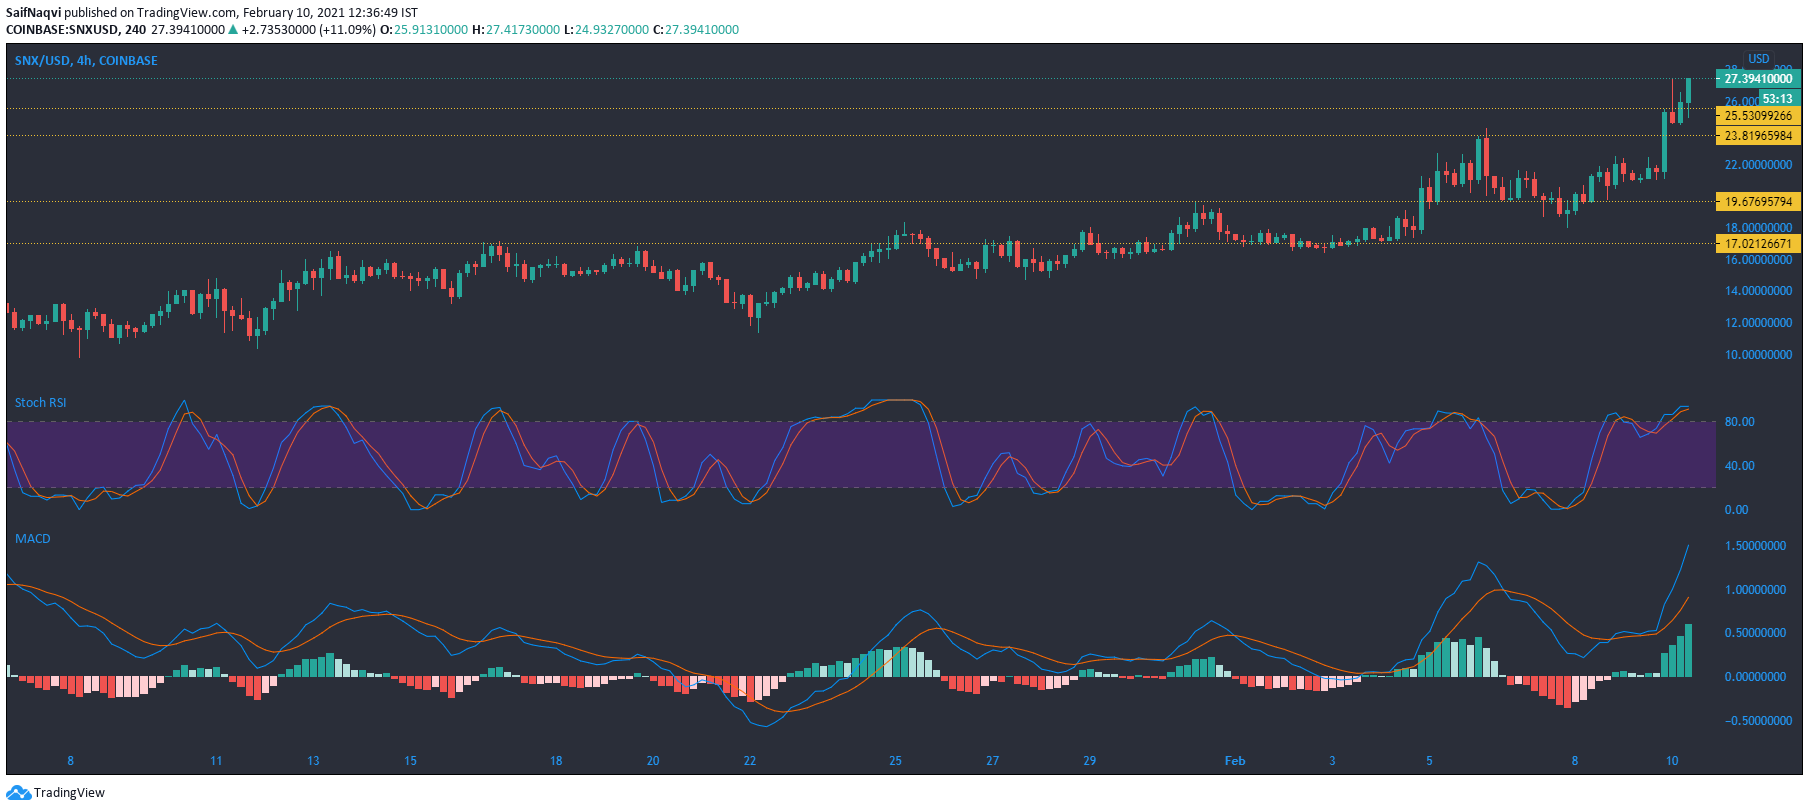
Synthetix added 28% to its value in the last 24 hours, with the price trading at an all-time high of over $27, at press time. The 24-hour trading volume surged by over 90% as the cryptocurrency looked set to snap newer highs in the coming sessions. The MACD underlined the strong bullish momentum as the fast-moving line climbed well above the Signal line.
On the other hand, some saturation was seen in its market according to the Stochastic RSI, with the same in the overbought region. A bearish crossover following a drop in the Stochastic RSI could see SNX move lower to its first and second levels of support at $25.5 and $23.8, respectively.
VeChain [VET]

Source: VET/USD, TradingView
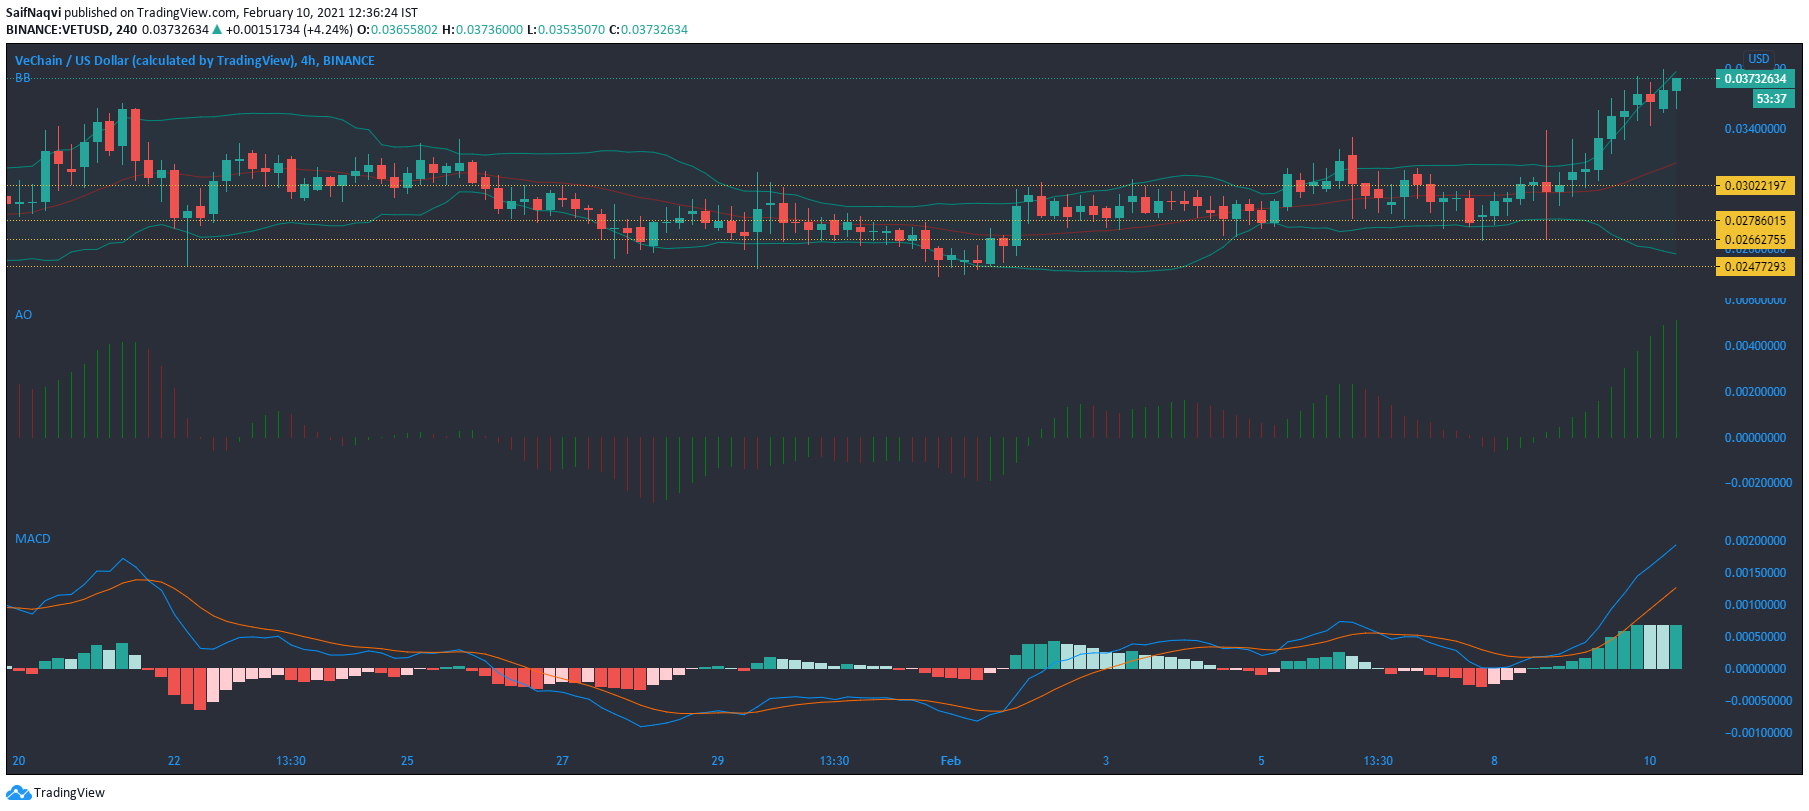
Much like its counterpart SNX, VeChain also traded at record levels, at the time of writing. The gains came on the back of a bullish broader market and an uptrend that saw the cryptocurrency post gains of nearly 50% in the last 30 days. The Awesome Oscillator’s green bars rose sharply and highlighted the strong momentum on the buyers’ side. The Bollinger Bands noted rising volatility in VET’s market as the candlesticks traded on the upper band.
While high volatility isn’t necessarily a downside, it comes with high risks, and there was a chance of a reversal over the next few sessions. In the event of a pullback, the support areas lay at $0.03 and $0.027.


