Litecoin: Traders can set their take-profits at these levels

A strong bullish response at an important support zone lifted Litecoin above its 38.2% Fibonacci level, for the first time since the 19 May crypto crash. Before setting its sights on the 50% and 61.8% Fibonacci levels, a market correction was expected due to RSI’s overbought nature.
A few areas that could trigger a selling response can be found on the 4-hour timeframe. At the time of writing, LTC traded at $219.8, up by 15% over the last 24 hours.
LTC 4-hour Chart
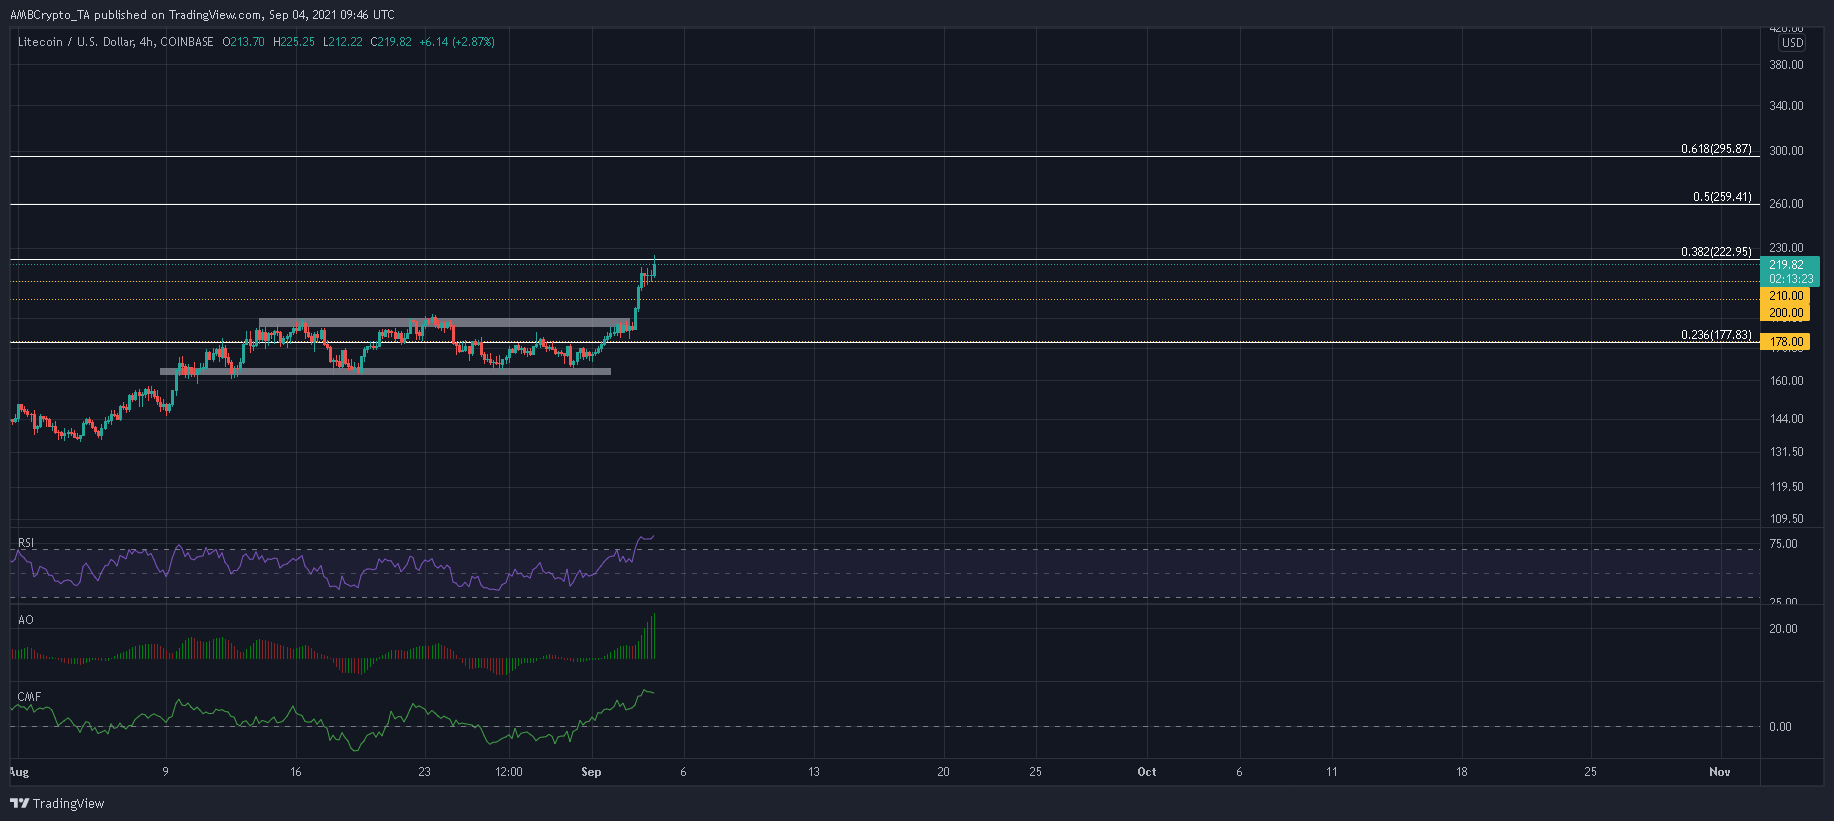
Litecoin’s close above $190 was supported by strong volumes as the alt toppled $200 and $210 with relative ease. In fact, volumes over the last 24 hours clocked in at $5.9 Billion and stood higher than ADA and XRP. The next major target now rested at the 61.8% Fibonacci level close to the $300-mark. However, another 30% push was unlikely before a healthy retracement.
Areas that could induce selling pressure were at the 38.2% Fibonacci level, and within the resistance zone between $233-$245. A retracement would find the coin at the newly flipped support levels of $200 and $210. Moreover, a deeper selling reaction could bring $190 back into play.
Reasoning
The RSI ventured into overbought territory and traded at levels last seen in early-January when LTC snapped a multi year high at $188. Incidentally, the market suffered a 40% sell-off in the following days. However, BTC’s retracement in January had a large role to play back then.
With the king coin now targeting a move above $50K, such a sharp reaction by sellers was unlikely. The Awesome Oscillator also peaked to multi-month highs. When LTC prices do correct, a close eye must be kept on this index. A lower high would give rise to a bearish twin peak setup.
Finally, LTC’s jump was supported by healthy capital inflows. The Chaikin Money Flow stood at its highest level since 26 May.
Conclusion
The sporadic 36% jump in just four days was expected to ease between $233-$245. Support found above $200 will allow LTC to resume its northbound trajectory, moving forward. However, a move towards $190 could be dangerous. Meanwhile, risk-averse traders can set their take-profits between the aforementioned resistance and long LTC at some important support areas.