Litecoin, Tron, Elrond Price Analysis: 30 January

Litecoin failed to rise above its 200-SMA and traded close to its support at $130. Tron seemed to be under a correction as prices cooled off after touching a local high. Elrond snapped yet another all-time high, but the indicators pointed towards a bearish pullback.
Litecoin [LTC]
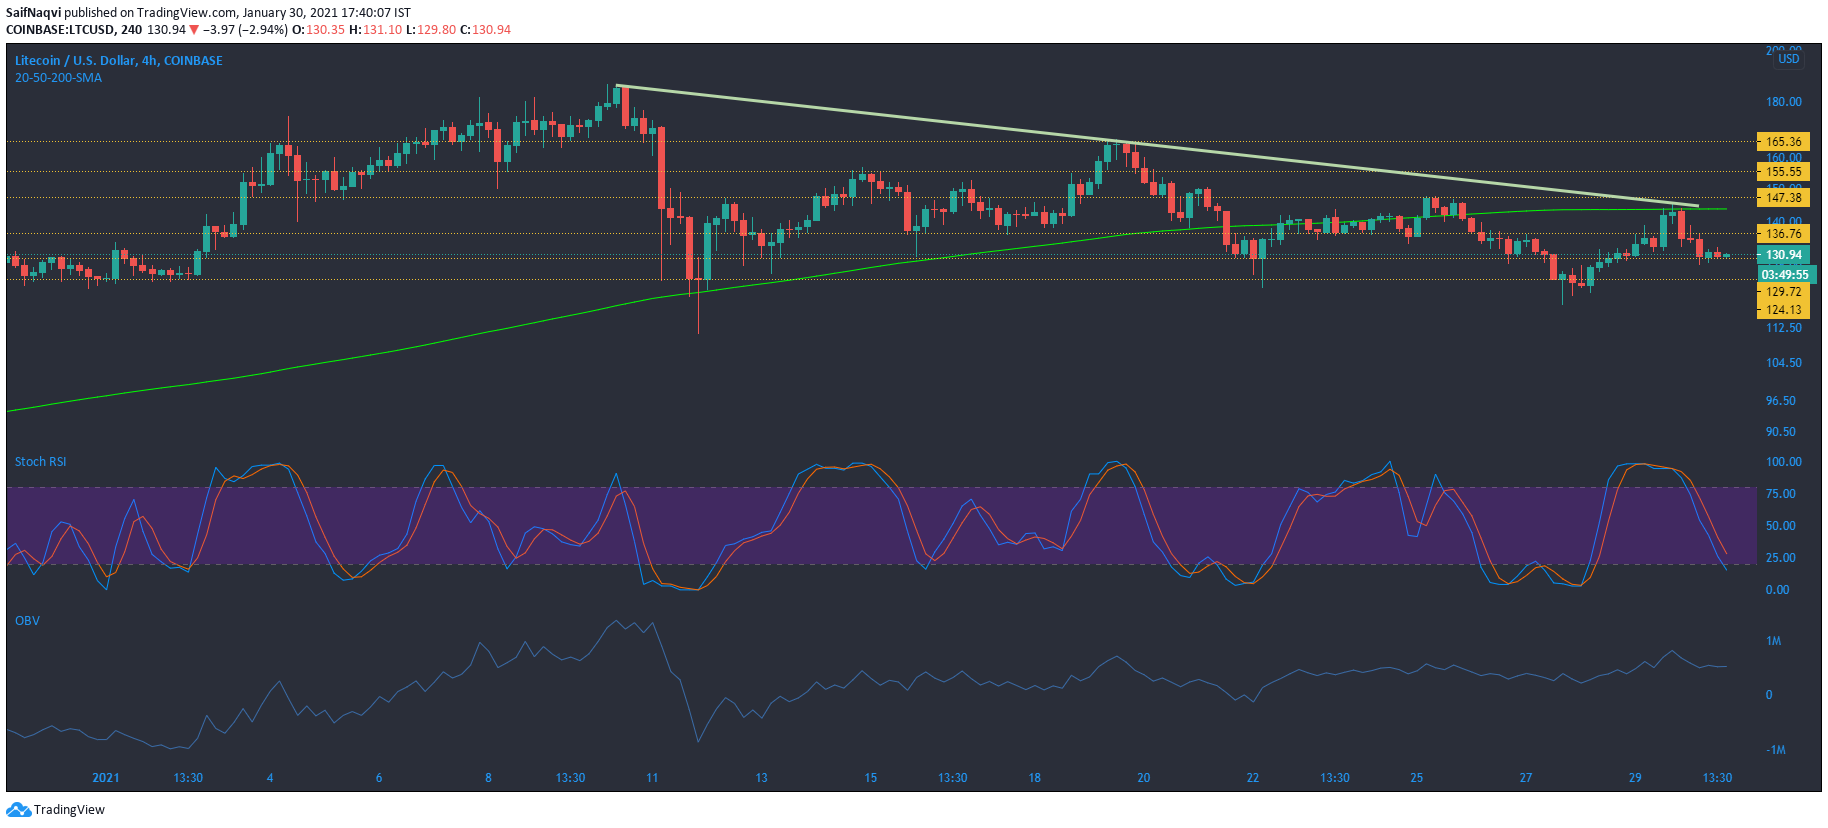
Litecoin was unable to break above its 200-SMA (green) and the price moved lower towards $130 support at the time of writing. In fact, the bearish cycle barely showed any signs of a reversal, as the Stochastic RSI was yet to reach the oversold zone and the On Balance Volume showed that buying activity was subdued. A downwards breakout could see the price move towards support at $124.
However, there was some optimism in the market as trading volumes picked up over the last 24 hours. If Litecoin witnesses an influx of buyers over the coming sessions, the price could rise and test its 200-SMA once again.
Tron [TRX]
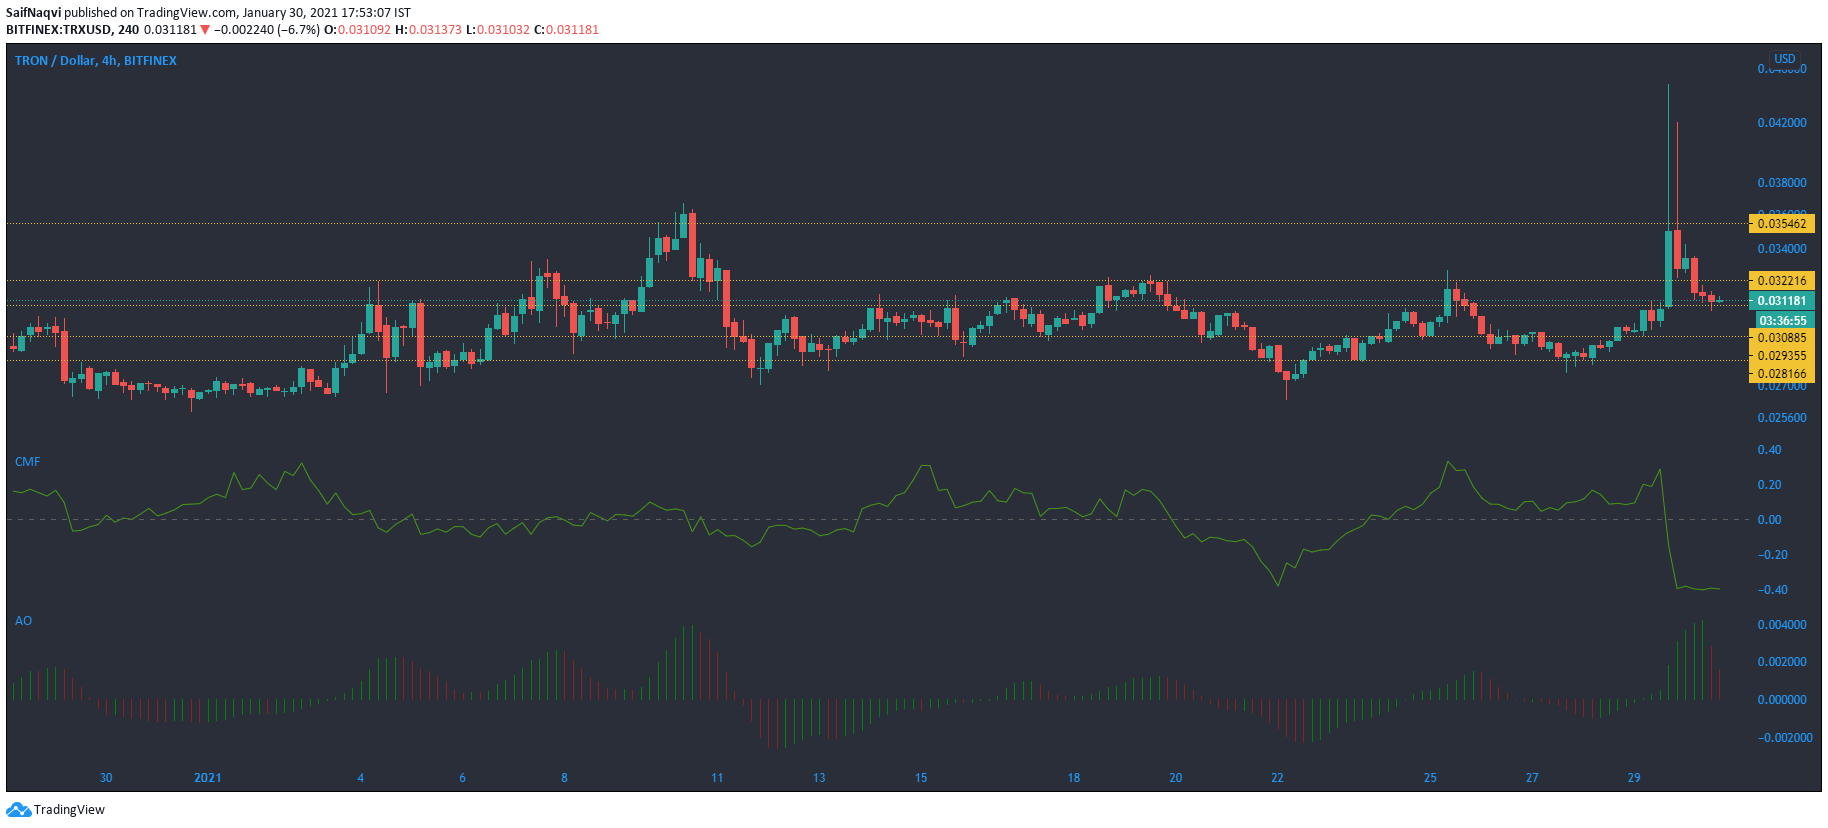
Tron witnessed a spike in price yesterday, as the candlewicks rose as high as $0.44 which marked a local high. However, a correction soon followed and TRX traded close to $0.030 support at press time. The magnitude of recent losses was highlighted by the Chaikin Money Flow, which fell sharply below the equilibrium mark. In fact, the CMF touched a low of -0.4 – a level last seen in March 2020.
If the price continues its trajectory over the coming sessions, support at $0.308 could be toppled. The Awesome Oscillator backed the bearish prediction, as the index noted an increase in bearish momentum. On the other hand, if losses are maintained at the current support mark, a bullish scenario could see TRX rise above $0.032 resistance once again.
Elrond [ELGD]
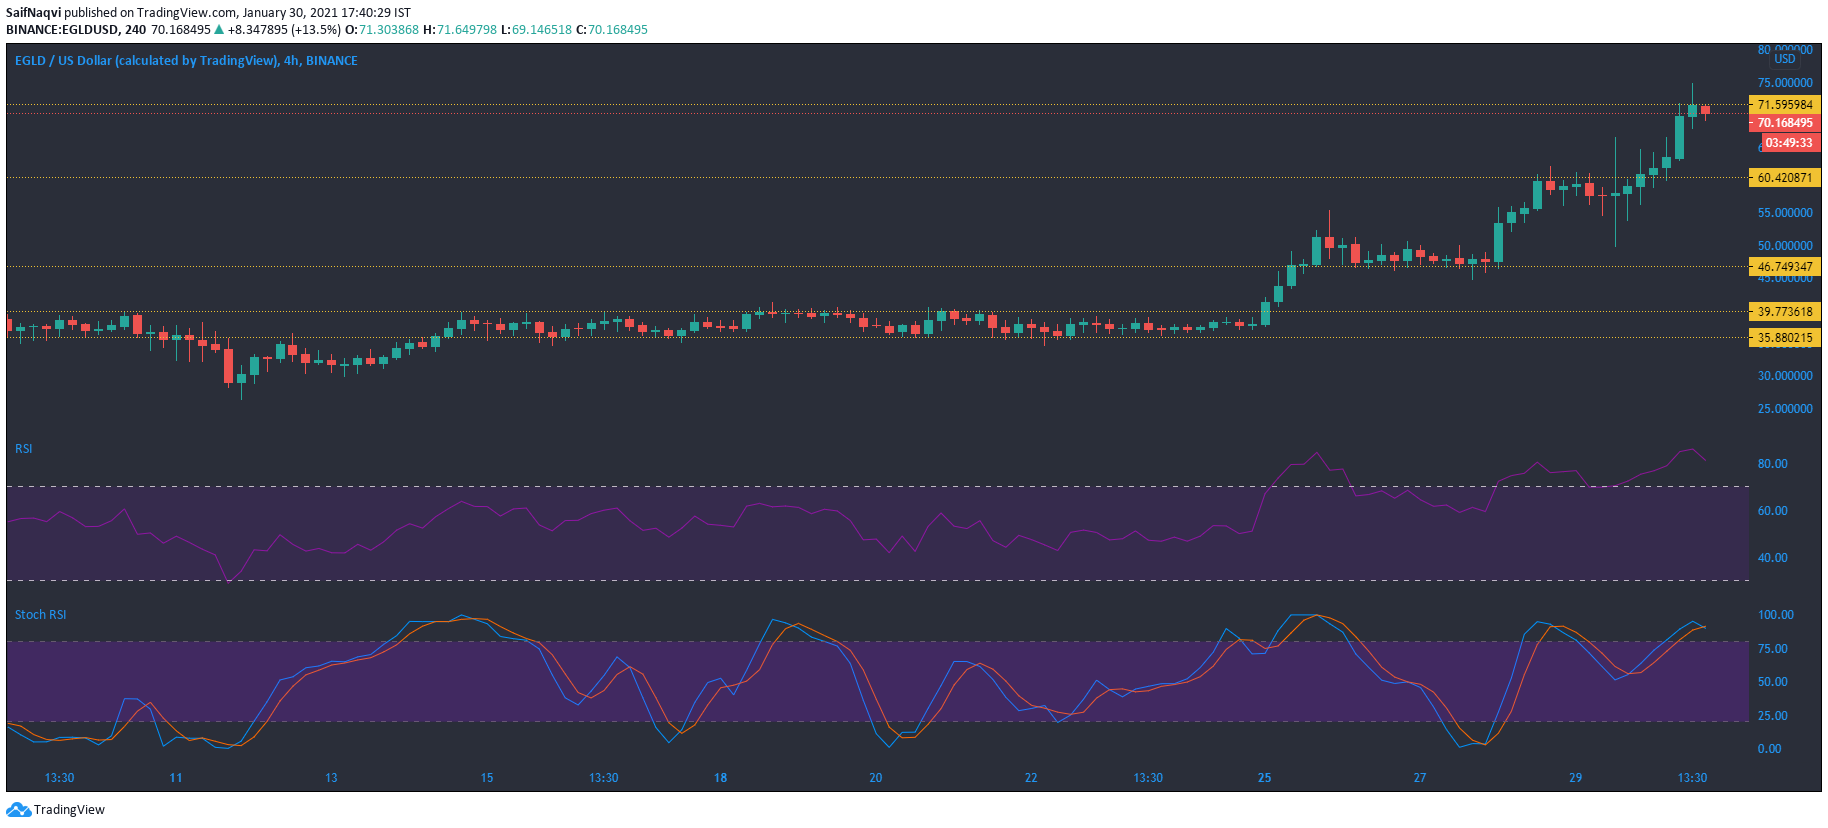
Elrond continued its upward ascension on the charts as the cryptocurrency snapped yet another record level at $71.1. Since the breakout above the $40 level, ELG has been in an uptrend, constantly snapping higher highs on the charts. The rise, which has pushed gains to over 90% in the past seven days, has been backed by strong trading volumes and a flurry of buyers in the market.
Nevertheless, ELGD looked primed for a reversal as the Relative Strength Index and the Stochastic RSI pointed lower from the overbought region. The last trading session also priced in the bearishness as the candlestick switched to red. However, the bearish reversal was not a guarantee since there were a significant number of buyers in the market.