


After more than a week of sideways consolidation under the $52,000-mark, Bitcoin, the world’s largest cryptocurrency, finally moved closer to its ATH over the past 24-36 hours. The effect of Bitcoin’s surge was immediate, with most of the altcoin market following suit. However, BTC’s impact wasn’t uniform, with some cryptos seen to be correcting slightly over the past few days.
Litecoin [LTC]
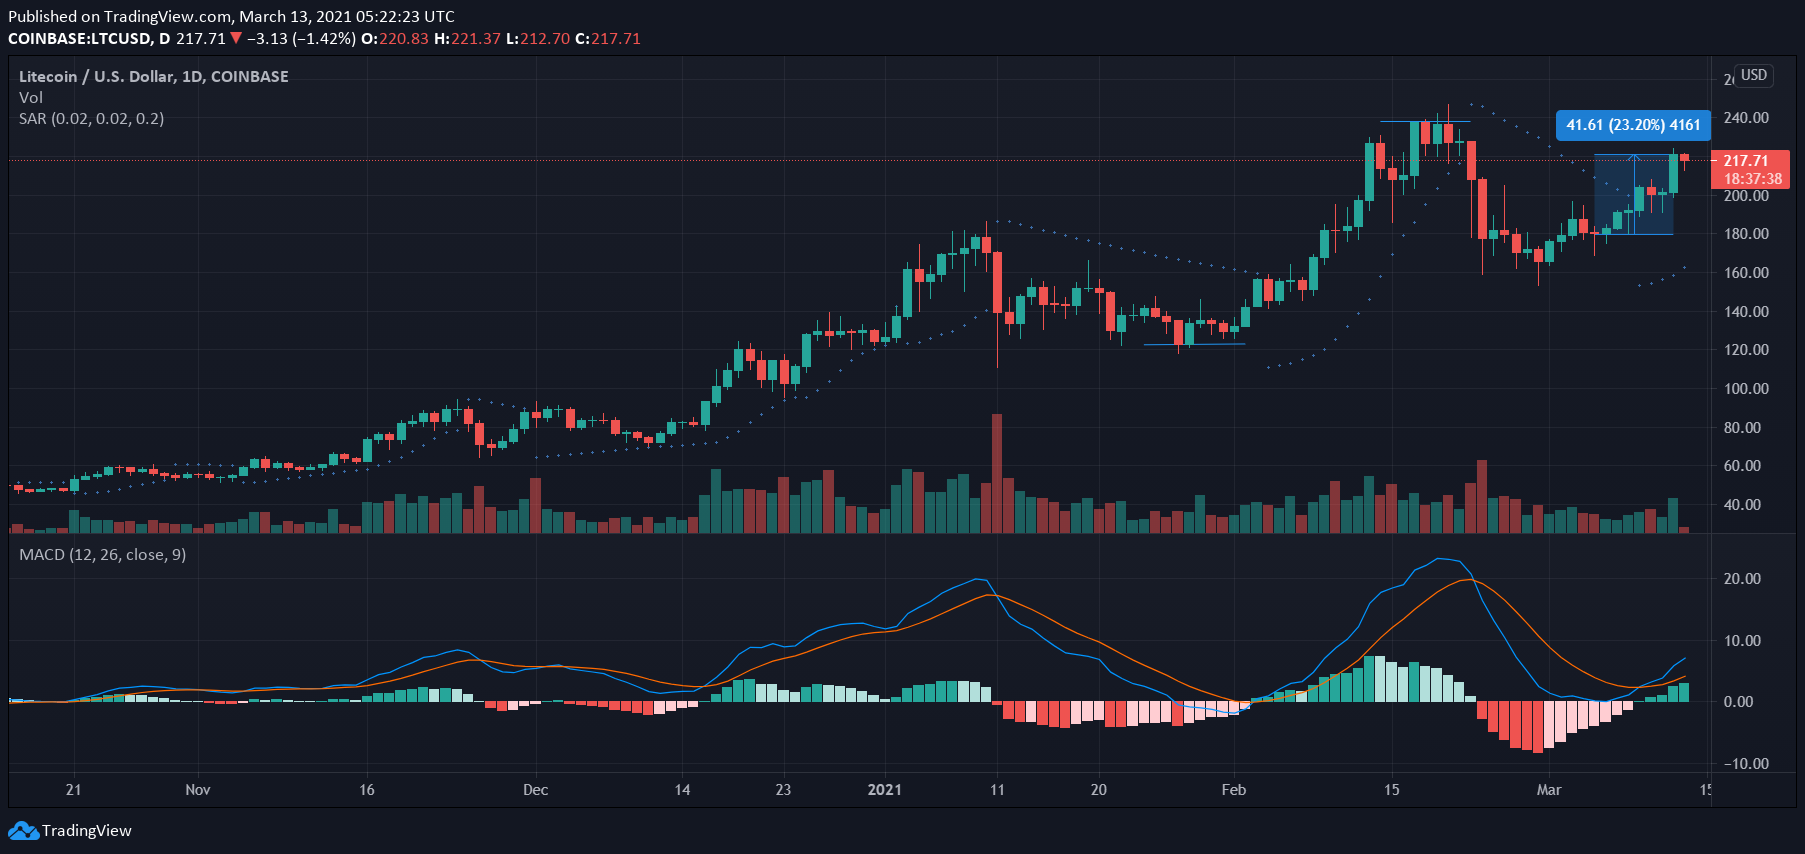
Litecoin, one of the market’s more popular altcoins, has always shared a high correlation with Bitcoin. The same was in display over the past few days or so after the silver coin appreciated on the charts following BTC’s sustained foray above the $52,000-mark. In fact, the scale of the crypto’s hike has been incredible, with the alt climbing by over 23% in a matter of days.
It is worth noting, however, that Litecoin’s trading volumes remain well below the levels seen for most of February.
While the Parabolic SAR’s dotted markers were well below the price candles and underlined the bullishness in the Litecoin market, the MACD line registered a sharp bullish crossover with the signal line.
Also, Bitcoin may have fueled LTC’s most recent move, but that may not be the case going forward, especially since the code for its MimbleWimble upgrade is expected to be ready by 15 March.
Waves [WAVES]

The cryptocurrency ranked 76th on CoinMarketCap’s charts at the time of writing, WAVES’ movement has been quite contrary to Litecoin’s over the past few days. While the world’s largest cryptocurrency did spur the price appreciation of a lot of assets, this altcoin wasn’t among them.
In fact, WAVES has been correcting steadily on the charts, a development that may be somewhat of a surprise since it came on the back of the alt gaining by over 14% in 72 hours.
In the near-term, however, the altcoin’s technical indicators seemed to suggest that such corrections will flatten out. The Bollinger Bands, for instance, were closing in on the price candles, a sign of limited price volatility. Further, the Awesome Oscillator pictured barely any momentum on the histogram.
Compound [COMP]
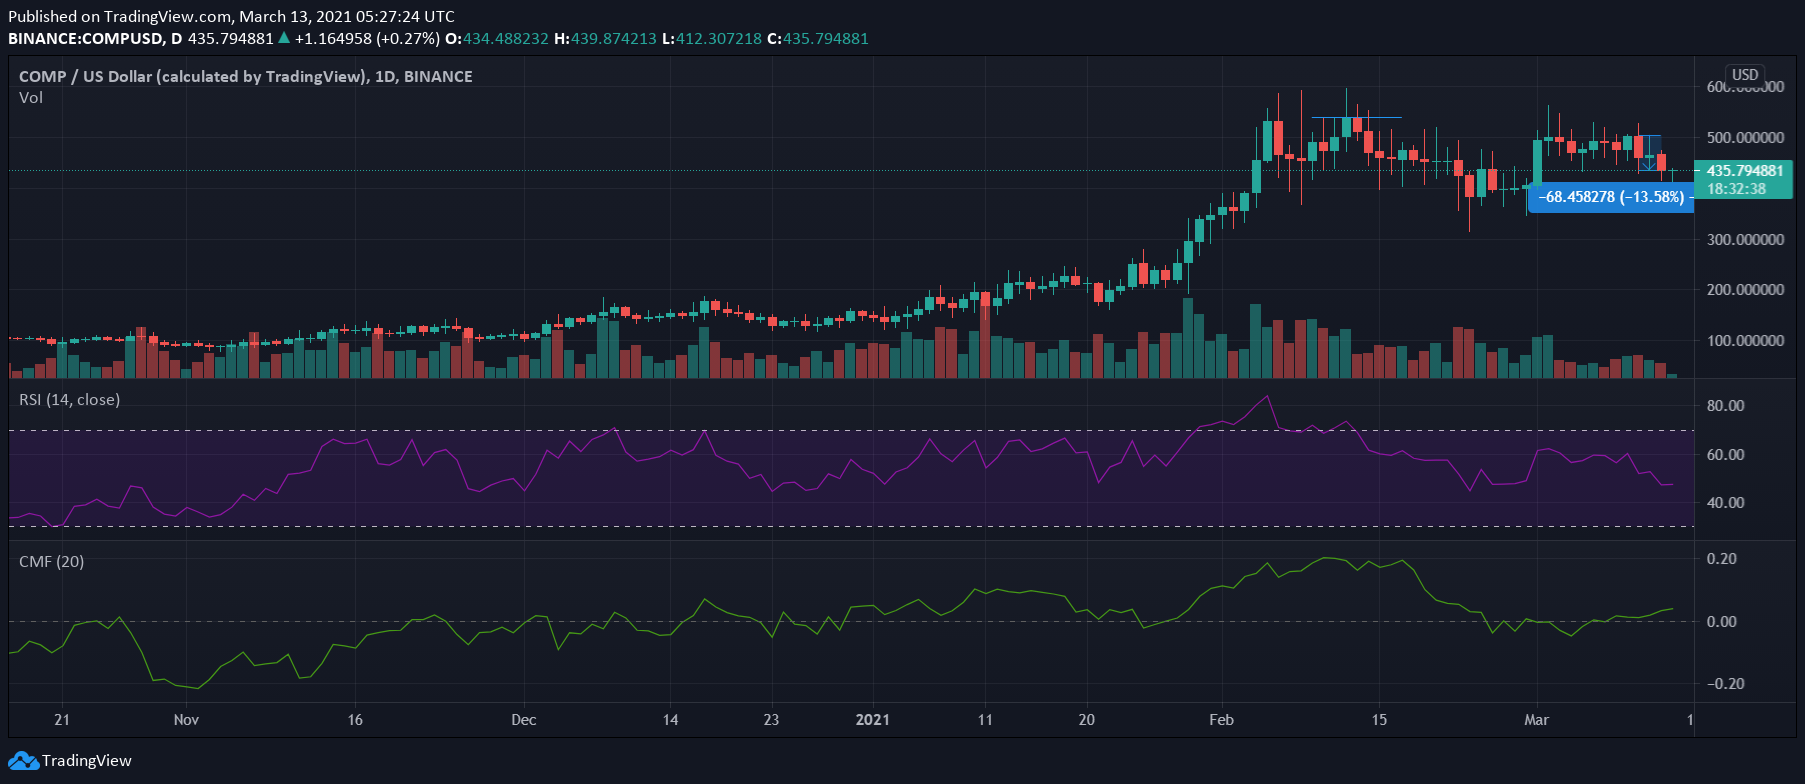
Like Waves, COMP too has been correcting on the charts over the past few days, with the crypto down by over 13% in the last 72 hours. Its latest depreciation notwithstanding, the altcoin was still trading close to its local top on the charts, at press time. Further, it was still unclear whether the aforementioned downtrend is likely to continue in the near-term.
While corrections have been the norm lately, the altcoin’s technical indicators continued to lean towards the market’s bulls. While the Relative Strength Index was mediating right between the oversold and overbought zones, the Chaikin Money Flow was gradually climbing over zero.
Compound was in the news recently after it announced Gateway, a blockchain that will use Parity’s substrate platform to add support for new assets.