Litecoin’s $100 target: Why it might remain out of reach for now
Though Litecoin tested a key support level, metrics hint at a continued bearish influence.

- LTC was down by 2% in the last 24 hours.
- Market indicators suggest a further price drop.
Litecoin [LTC] had a few harsh months as it kept losing its market capitalization by a large margin. However, the coin broke above a pattern that hinted at a bull rally. Therefore, AMBCrypto planned to take a look at its metrics to find out whether investors should expect a bull rally.
Litecoin to begin a bull rally soon?
According to CoinMarketCap, Litecoin’s price dropped by more than 2% in the last 24 hours alone. At the time of writing, LTC was trading at $84.04 with a market cap of over $6.2 billion, making it the 20th largest crypto.
Though the current trend is bearish, a recent analysis highlighted an important incident. As per the tweet, Litecoin broke above a key resistance level and also successfully tested a “retesting” period.
For starters, this means that a token, after retesting, might begin a bull rally. If this translates into reality, then Litecoin might witness a massive jump in its price over the coming weeks.
This can be expected for LTC
Since there were chances of a bull rally, AMBCrypto planned to check LTC’s state to better understand what to expect from the coin. As per our analysis of Glassnode’s data, LTC’s Network Value to Transactions (NVT) ratio dropped.
A decline in the metric means that an asset is undervalued. This suggests that the possibility of LTC going up in the coming days is high.
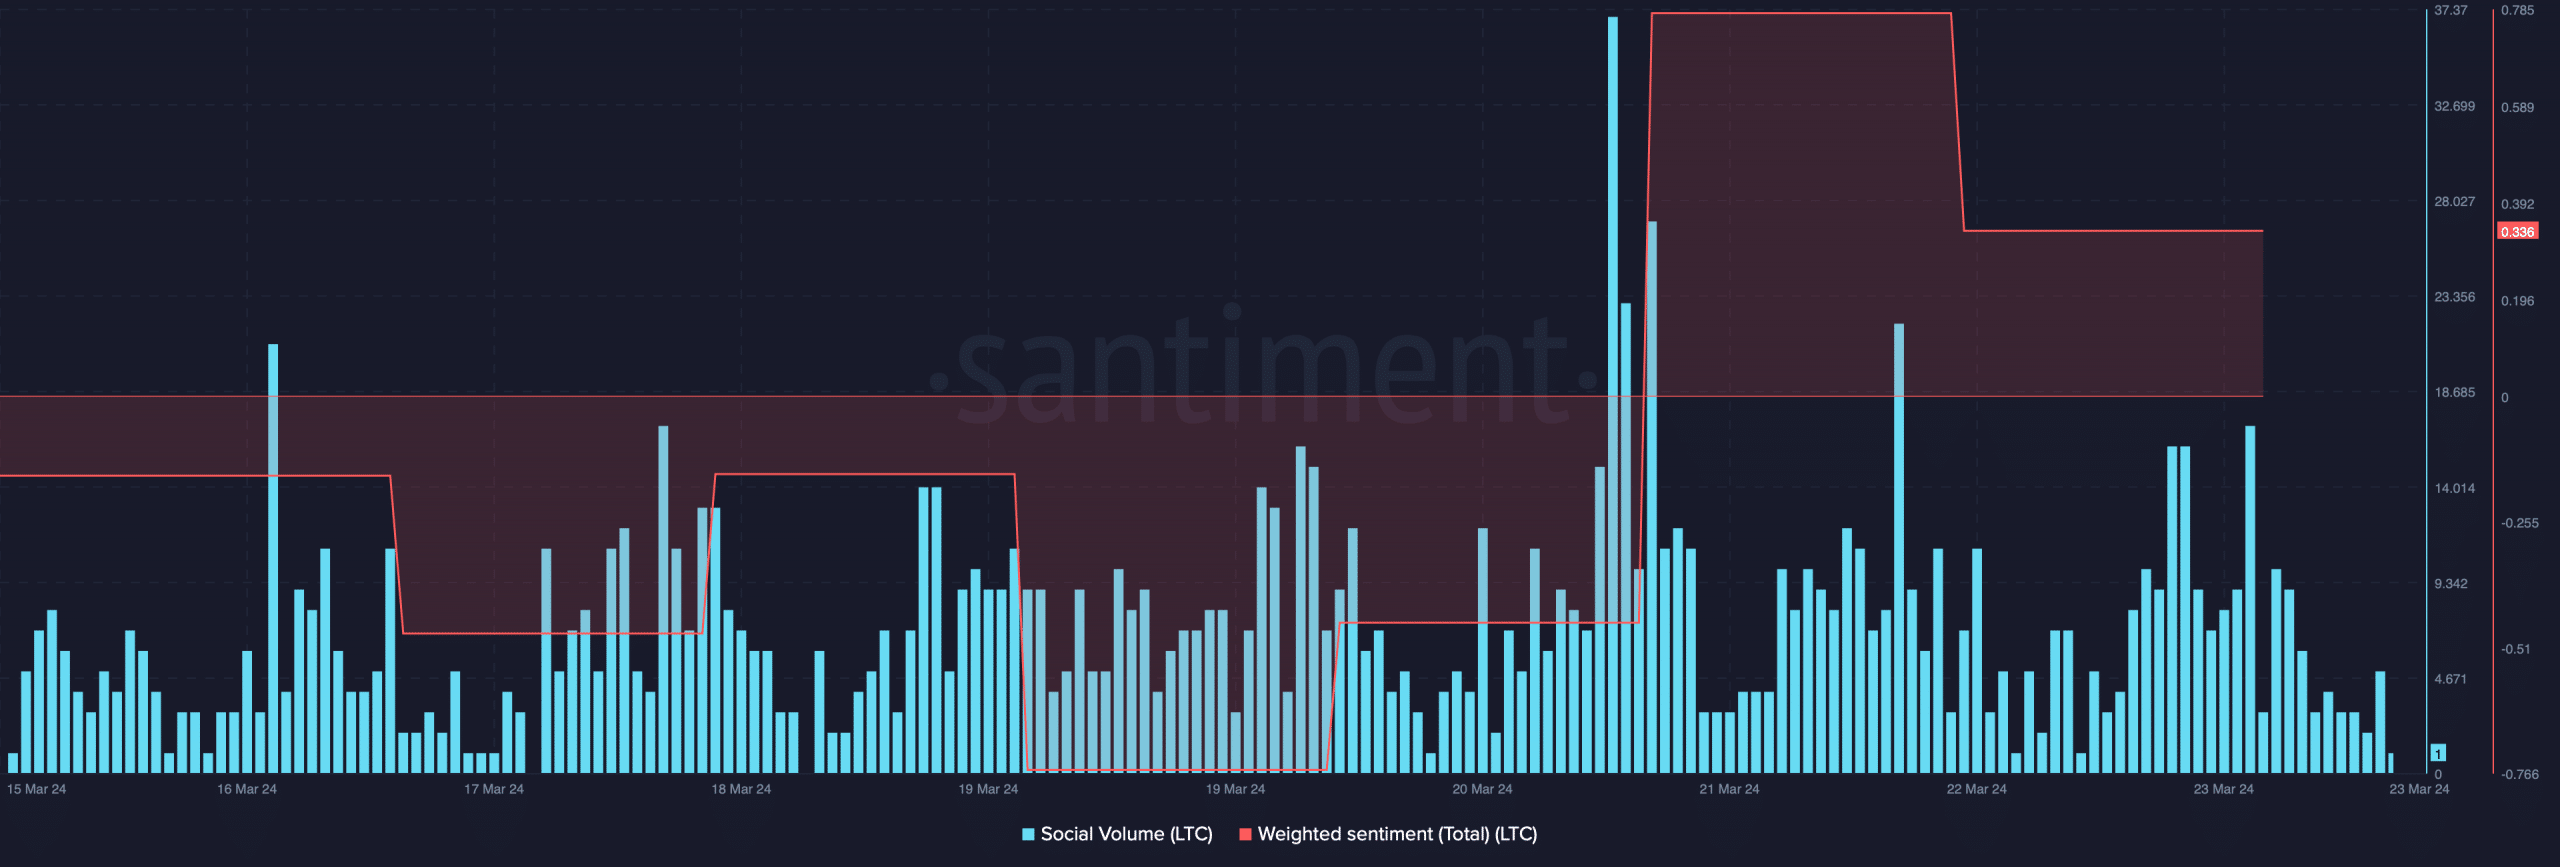
To better understand what is actually going on with LTC, we took a look at Santiment’s data. As per our analysis, Litecoin’s social volume spiked on the 21st of March. This clearly indicated a rise in its popularity.
Its weighted sentiment also spiked during that time, but the graph dropped later, meaning that bearish sentiment around the token increased.
Read Litecoin’s [LTC] Price Prediction 2024-25
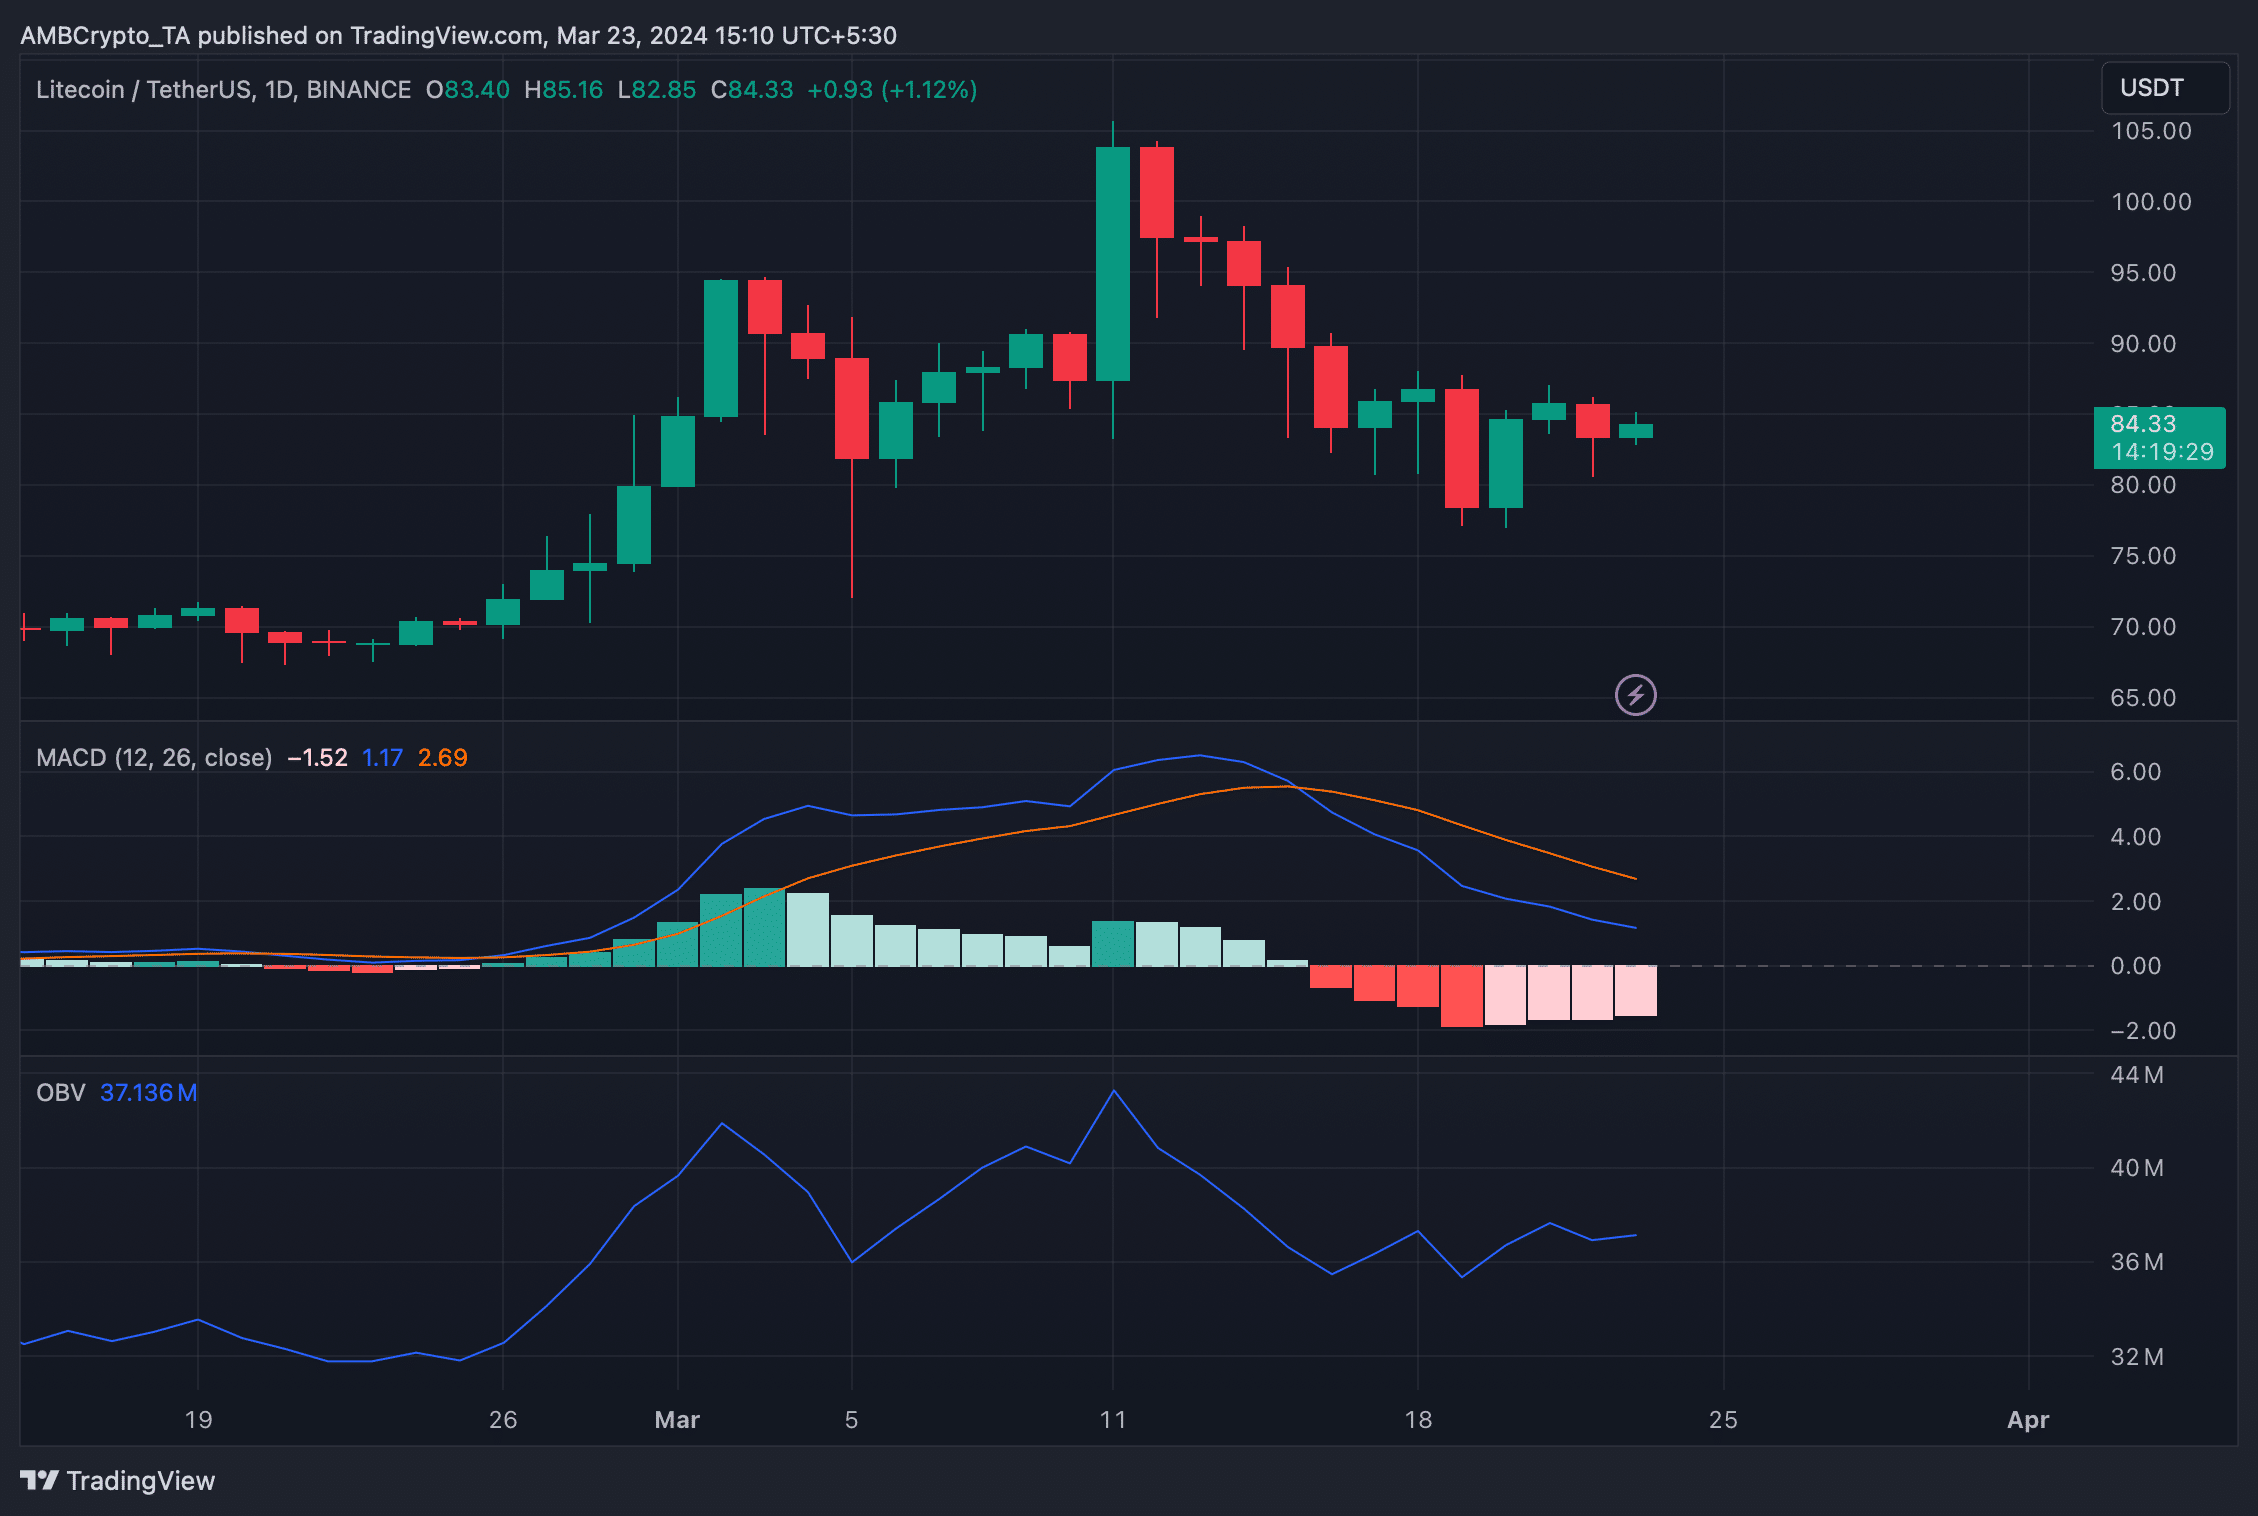
We then took a look at LTC’s daily chart to see which way it was headed. As per the analysis, technical indicators continued to remain bearish.
For instance, the MACD displayed a bearish upperhand in the market. On top of that, the On Balance Volume (OBV) also went sideways. These indicators hinted at a further drop in Litecoin’s price in the coming days.