Disclaimer: The findings of the following analysis are the sole opinions of the writer and should not be taken as investment advice
Unable to find a clear direction despite Bitcoin’s ascent, Litecoin remained gridlocked within a descending triangle setup. While the pattern normally observes a breakdown, LTC’s outcome is not yet clear.
The altcoin was trading above its near-term SMAs and its indicators took a neutral approach. In order to pinpoint LTC’s trajectory, the price needs to close above or below certain key areas on the chart.
At the time of writing, Litecoin was trading at $195, up by 0.6% over the last 24 hours.
Litecoin 4-hour Chart
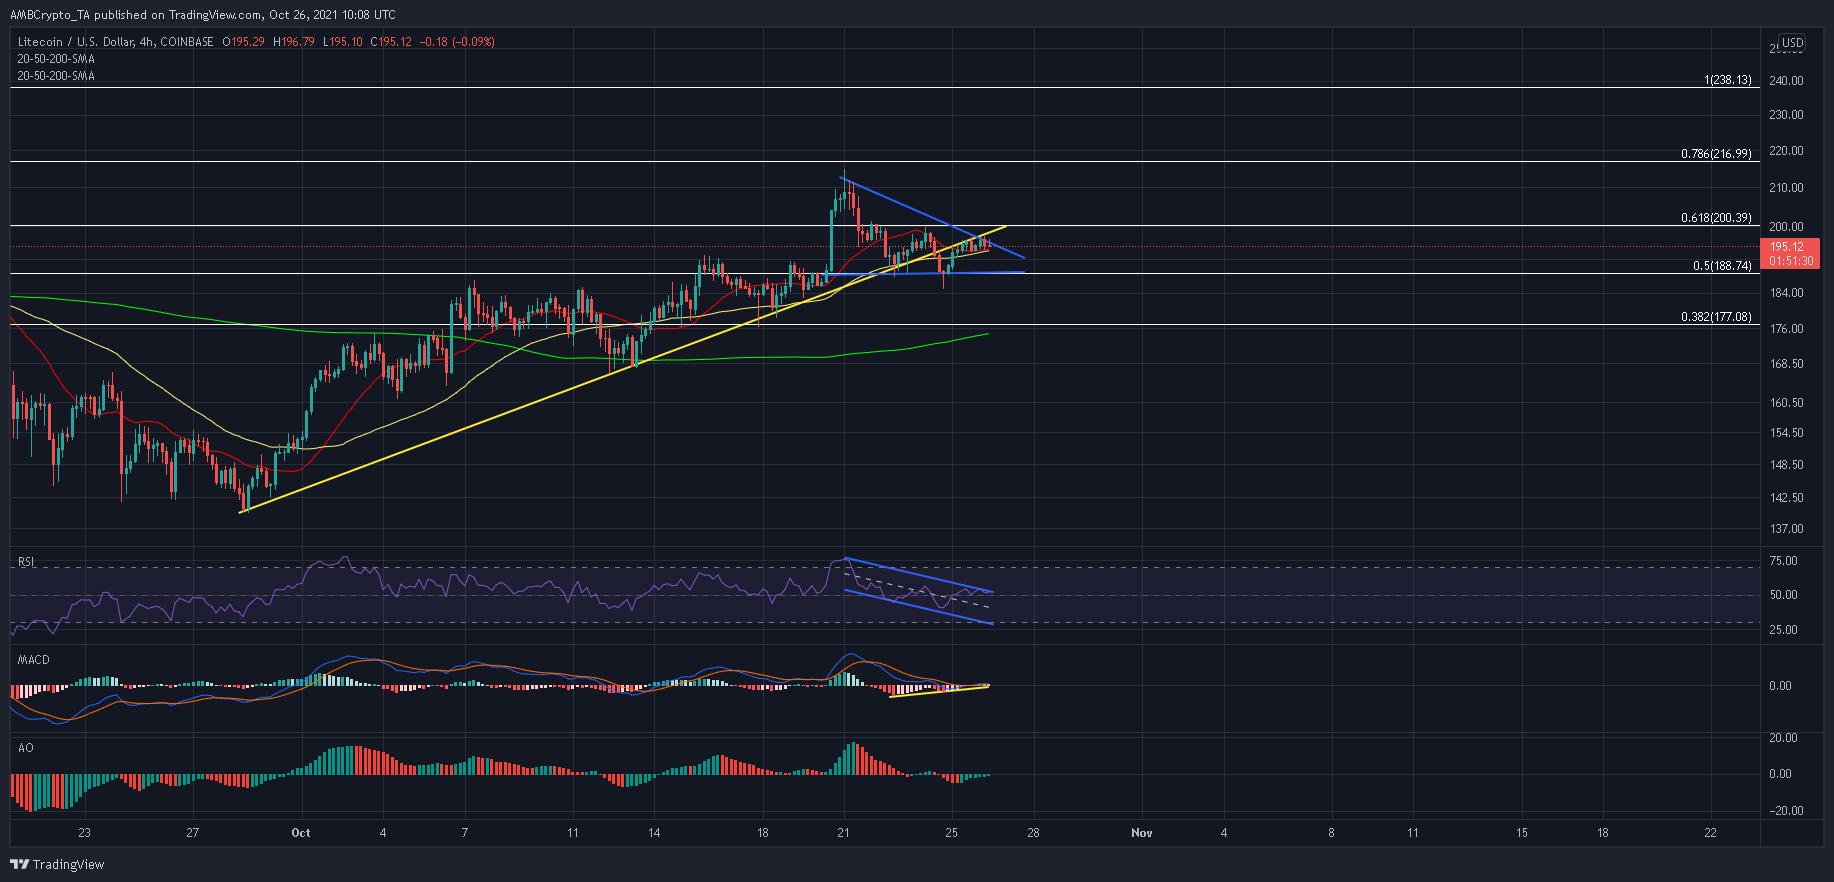
Source: LTC/USD. TradingView
Three successive lower highs at $215, $200, and $197 highlighted a downtrend for LTC after a 16% run-up was observed last week. When combined with the two lows formed at the 50% Fibonacci Retracement level, a descending triangle setup appeared on the 4-hour timeframe.
Should LTC cut below the confluence of its 20 (red) and 50 (yellow) Simple Moving Average lines, another attack on the baseline can be expected. From there, a near-term pullback of 6.5%-8% could come to light in case LTC weakens below the $188-mark.
Meanwhile, a close above the upper sloping trendlines and 61.8% Fibonacci level would set up an upwards breakout from the pattern. The next Fibonacci zone at $217 can be challenged immediately, provided the broader market remains risk on.
Reasoning
Now, the 4-hour RSI seemed to be traversing within a down-channel and a newer low could form at the lower trendline, below the 50-mark. Based on this outcome, there is a chance that LTC would break south from its triangle. The RSI would need to move above its upper trendline to invalidate this outlook.
On the other hand, the Awesome Oscillator presented a neutral bias after trading close to its half-line. Even though the MACD pictured similar movements, higher peaks along the histogram were encouraging for bullish traders.
Conclusion
There seemed to be valid arguments to support a breakout in either direction from a descending triangle. To play it safe, traders should wait for LTC to close above or below key levels before taking up positions in the market.
Bullish traders can long once LTC closes above the 61.8% Fibonacci level while short-sellers can enter the market once LTC closes below the 50% Fibonacci level.