
- Litecoin has been on a gradual and steady uptrend since the 5th of August, driven by buying activity.
- LTC has made a bullish SMA crossover on the four-hour chart that could see it target the $79-$80 price.
Litecoin’s [LTC] trading volumes were up by 16% at the time of writing according to CoinMarketCap, coinciding with rising buying activity around the token.
Since the crypto market crash on the 5th of August caused by weak U.S., employment data and the poor performance of tech stocks, Litecoin has been on a steady uptrend.
Its seven-day gains stood at around 7% at press time.
X (formerly Twitter) analyst Dann Crypto noted that LTC has formed a V-shaped recovery. The token has been making straight gains with no major price drops to disturb the rally.
The analyst stated,
“Pretty strange looking chart as this isn’t something we see often in crypto. Basically been straight up with no major dips since the flush early this month. Interesting price action worth noting.”
Buyers are driving Litecoin’s gains
The steady gains by Litecoin in the last two weeks could be attributed to consistent buying pressure around the token.
A look at the Relative Strength Index (RSI) on the daily chart showed a gradual rise in buying activity. The RSI line has also been making higher highs since early August.
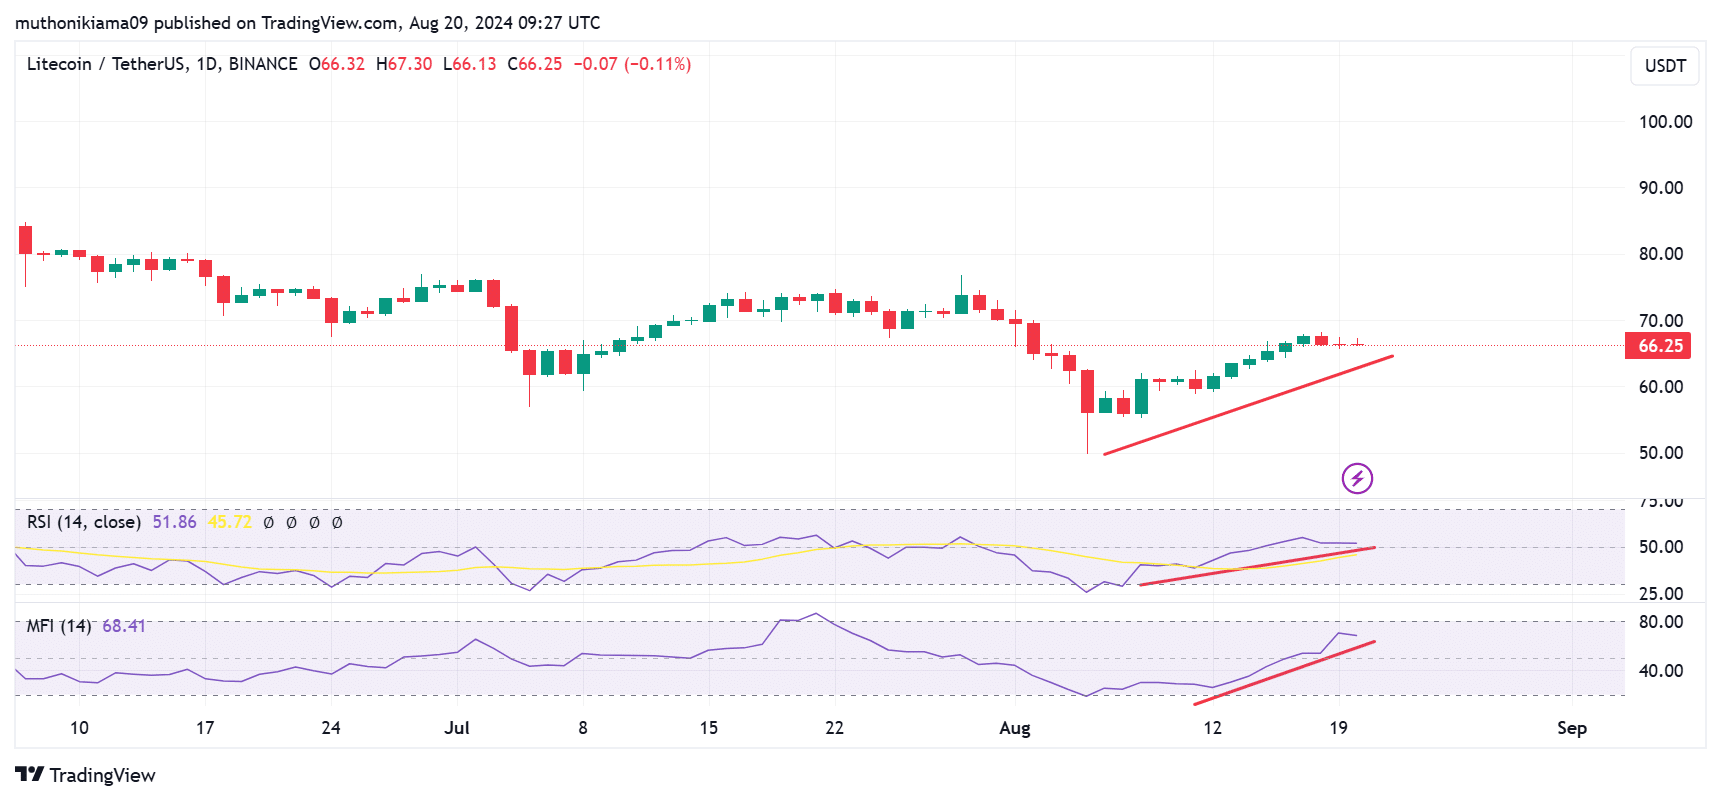
Source: TradingView
The Money Flow Index (MFI), which sat at 68 after a steady increase, indicated more inflows into Litecoin than outflows. This is usually a bullish signal, showing that buyers have been behind the price action.
However, as Litecoin’s rally appears to be solely driven by buying activity, traders should be cautious of any possible reversals.
The Awesome Oscillator (AO) is showing red histogram bars despite being in the positive region. This formation usually indicates that LTC is still in a bullish momentum.
However, the strength of the uptrend is weakening, which could be followed by a reversal or a short-term pause.
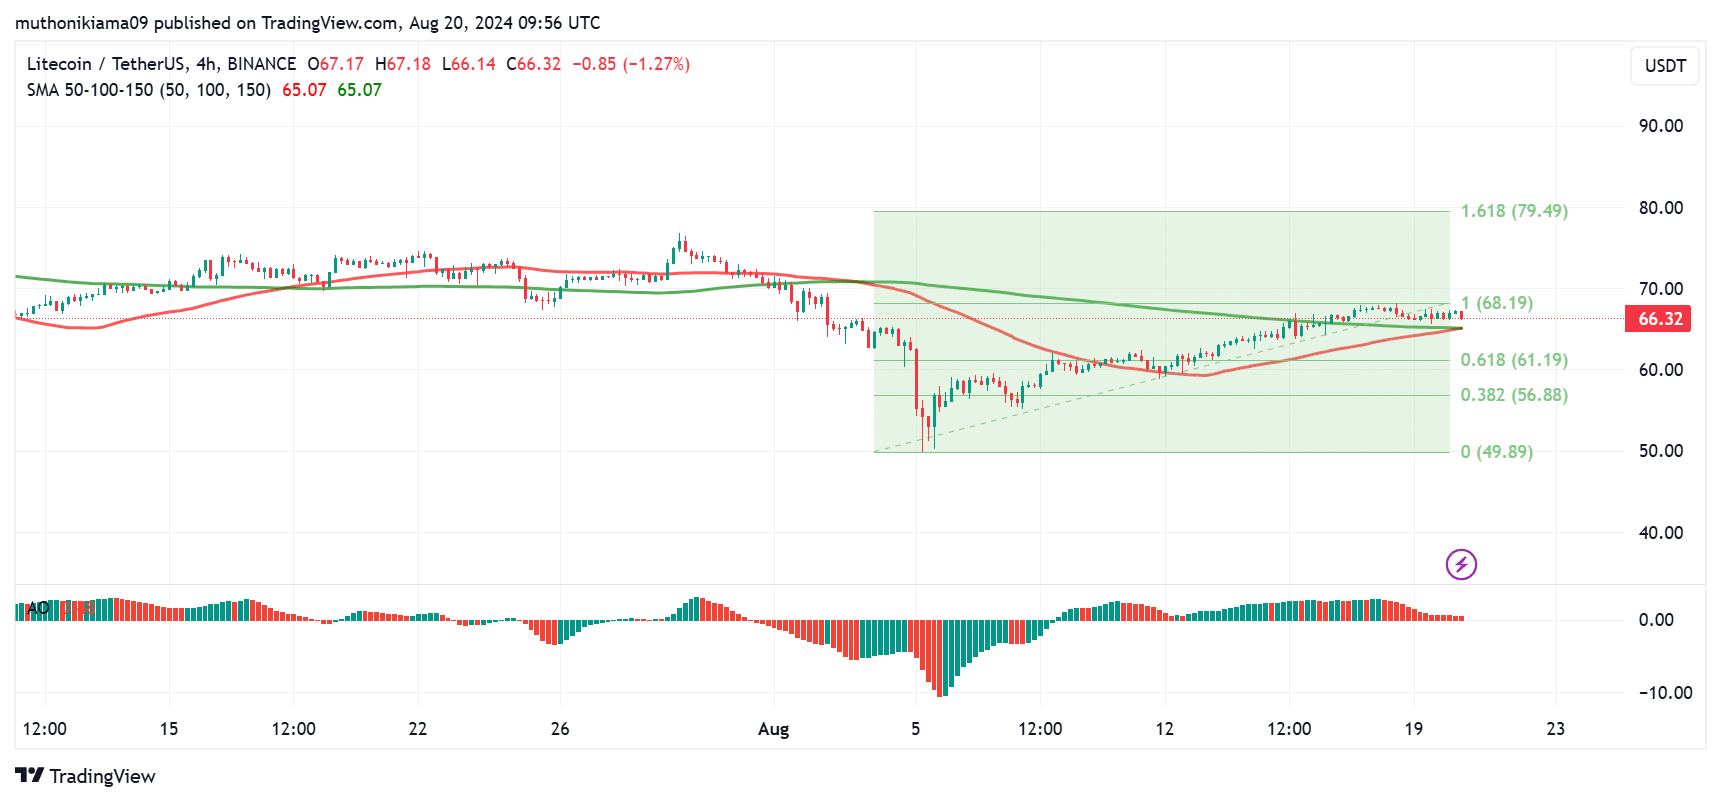
Source: TradingView
Nevertheless, the bullish thesis was reinforced by the Simple Moving Averages (SMAs). The 150-day SMA has shifted to below price, indicating that the long-term trend was positive.
Furthermore, the 50-day SMA was attempting a major bullish crossover above the 150-day SMA. This metric indicates that a bullish momentum was forming to support a continuous uptrend.
LTC has been rejected at the 100% Fibonacci level ($68) severally. If the price targets this resistance level again and breaks out, $79 could be on the cards for Litecoin.
Is your portfolio green? Check the LTC Profit Calculator
Data from IntoTheBlock showed that 577,000 addresses bought between $65-$69. This meant that the $68 resistance level might continue to hold if these traders decide to sell to mitigate losses.
Looking at the long/short ratio on Coinglass, the Futures market is flipping bearish on Litecoin. The ratio had dropped to 0.91 at press time, showing slightly more short positions than long positions.
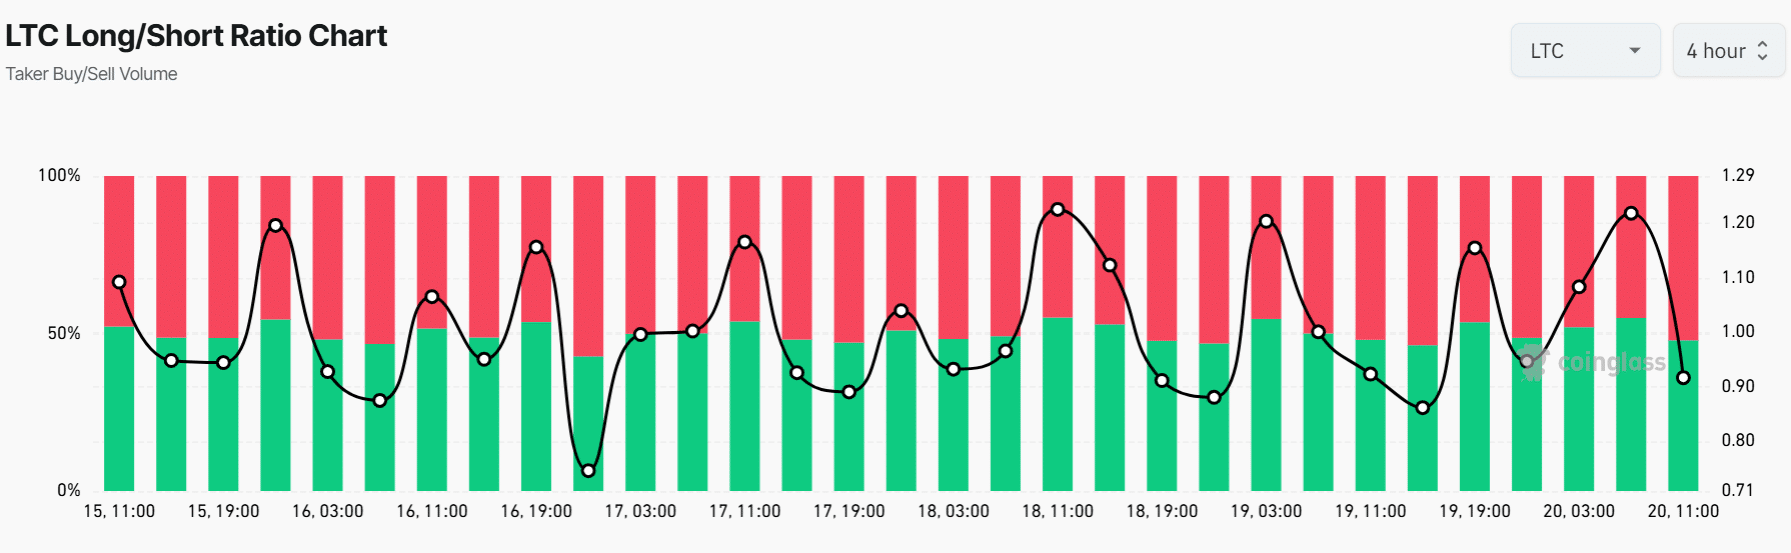
Source: Coinglass