Litecoin’s current movement might send it to the oversold zone

The only thing that has been surging with regard to Litecoin is the FUD around the implementation of MimbleWimble. The price of the altcoin, on the other hand, seems to be moving mostly sideways, with brief upward and downward surges.
At the time of writing, the coin was trading at $45.17, recording a 0.31% price fall over the last 24 hours.

Source – CoinStats
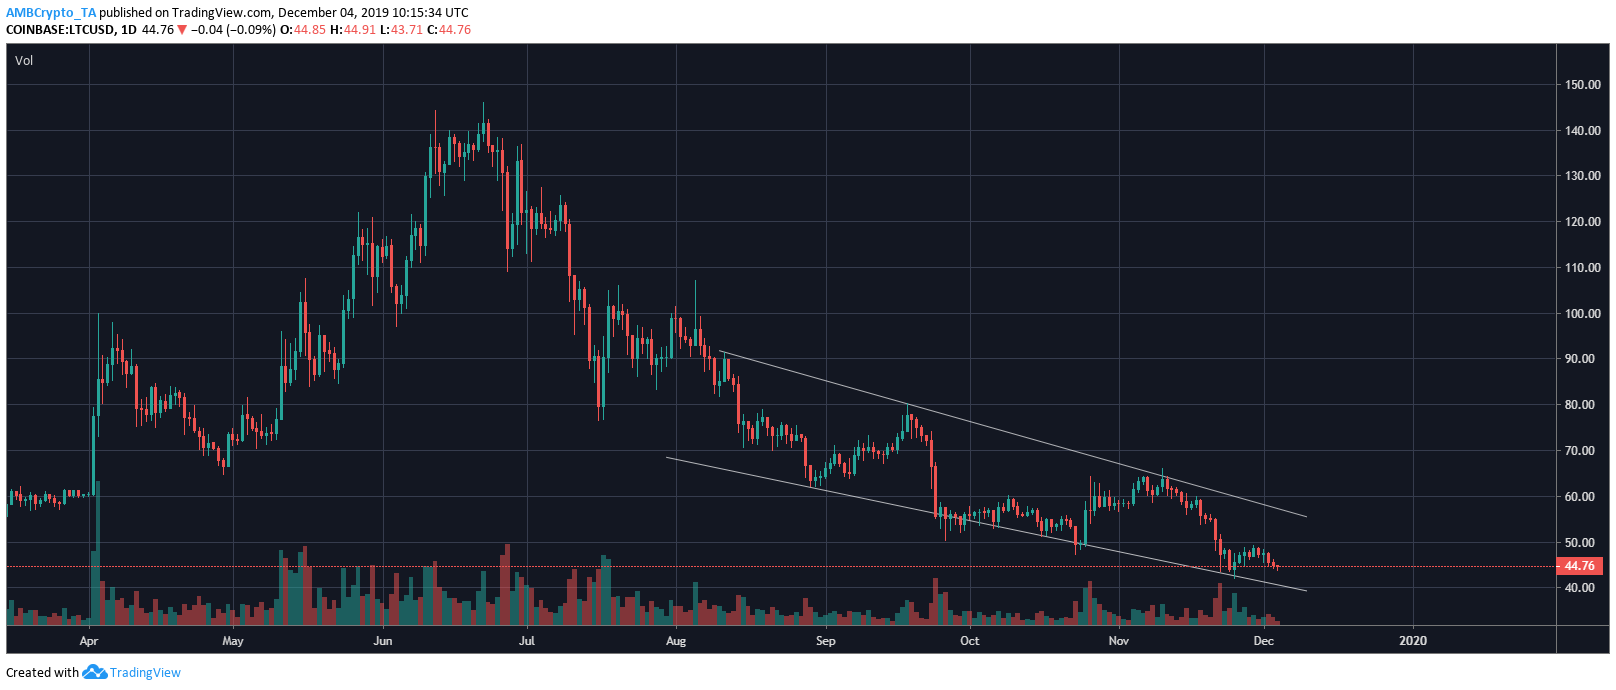
Litecoin’s 1-day chart

Source: LTC/USD on Trading View
Litecoin, on its one-day chart, entered into a falling wedge pattern, forming an upper trend line with lower highs at $91.32, $80.09 and $64.22. This was followed by a lower trend line with lower lows at $62.76, $49.33 and $42.99. The fairly low volume affirmed the formation of the aforementioned pattern. Additionally, for the coming week, a 77.47% chance of an upward breakout was also recorded on the one-day chart.

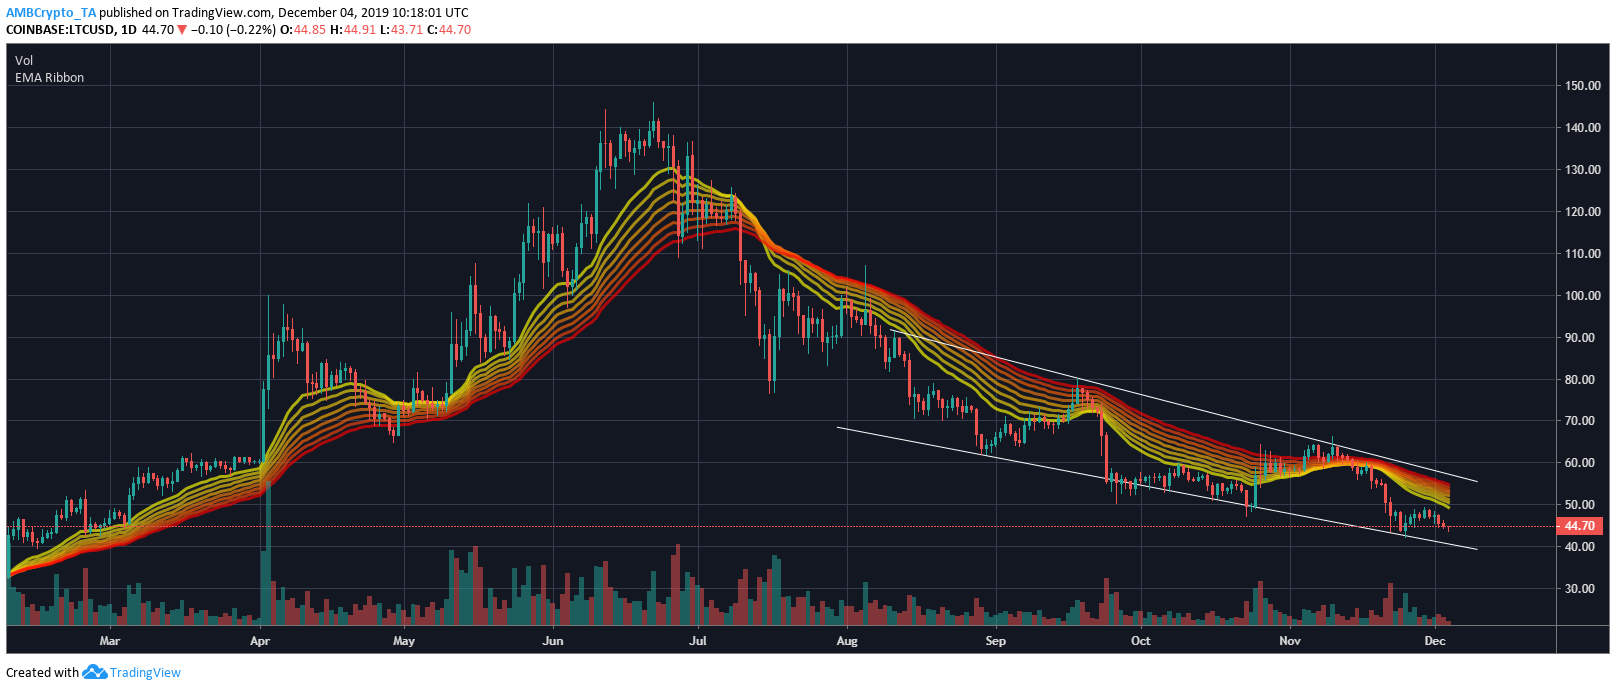
Source: LTC/USD on Trading View
Opposing the formation of a bullish pattern, the EMA Ribbon seemed to be telling a different story. Ever since July, the candlesticks were lounging below the EMA Ribbon. However, for a brief period in November, LTC moved below the EMA Ribbon. The current LTC market indicated bearish sentiment as it rested below the EMA Ribbon.

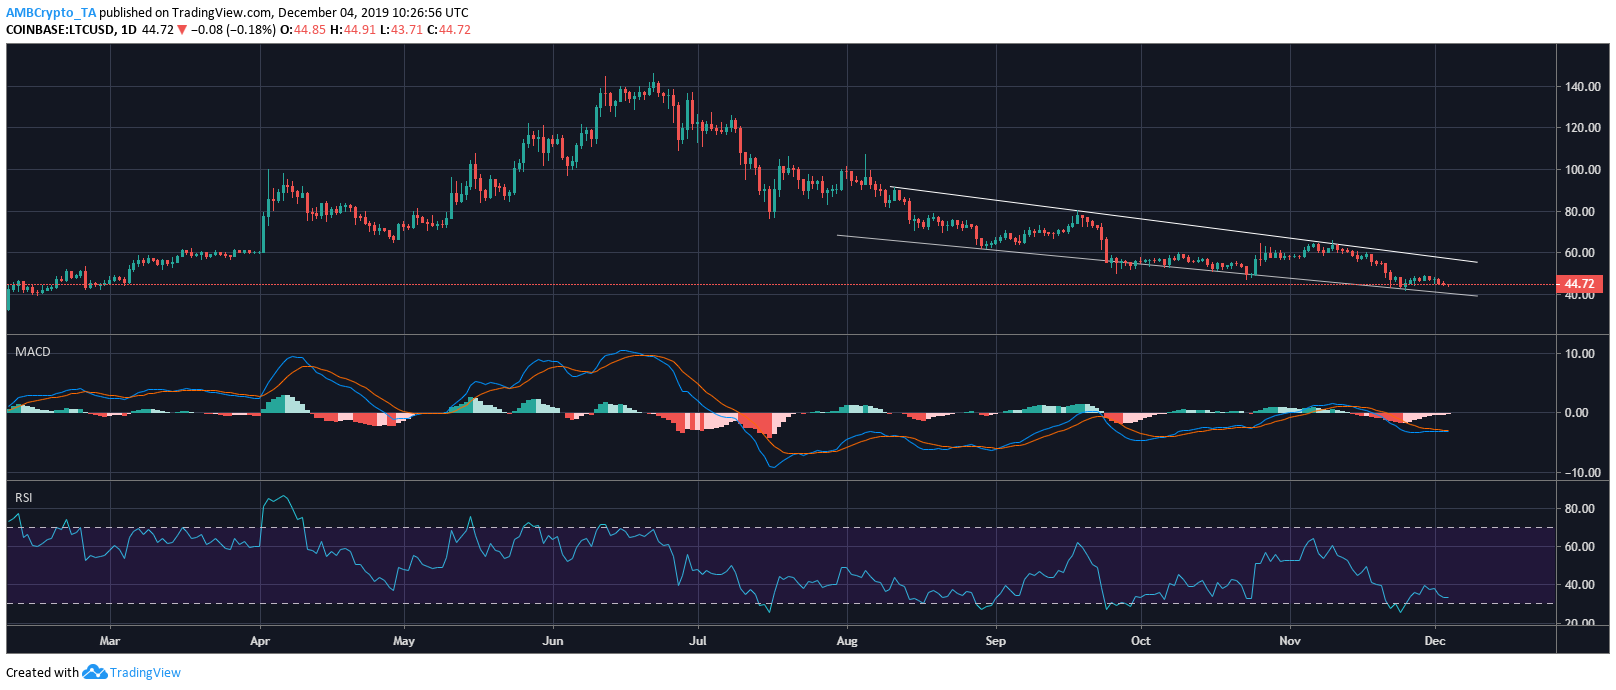
Source: LTC/USD on Trading View
Furthermore, other key indicators like the MACD and the Relative Strength Index [RSI] contradicted the formation of a bullish pattern. The MACD line was seen below the signal line, indicating a bear market. Ever since mid-November, the MACD indicator has highlighted the presence of bears in the LTC market.
The RSI marker was at a low of 33.28 median. While the altcoin was just recovering from entering the oversold zone towards the end of November, the current movement of the coin might shift it back to the oversold zone.
Conclusion
While the formation of a bullish pattern could resurrect the price of Litecoin, key indicators seemed to be taking the side of the bears.


