
The price of Litecoin, the sixth largest coin by market cap, has been depreciating since June 2019. Despite exhibiting some signs of recovery in November by hitting $64, the coin plummeted again and started moving sideways. At the time of writing, the coin was trading at a low of $46, recording a drop of 1.24 percent in its price over the last 24 hours. However, the short-term chart of Litecoin formed a bullish pattern, suggesting some hope for price recovery.
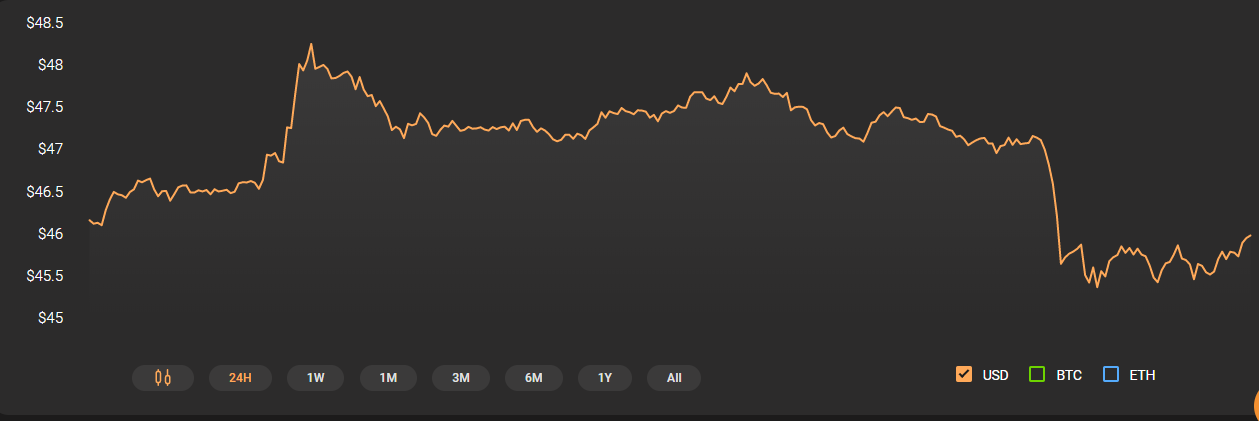
Source: CoinStats
Litecoin’s 1-hour chart
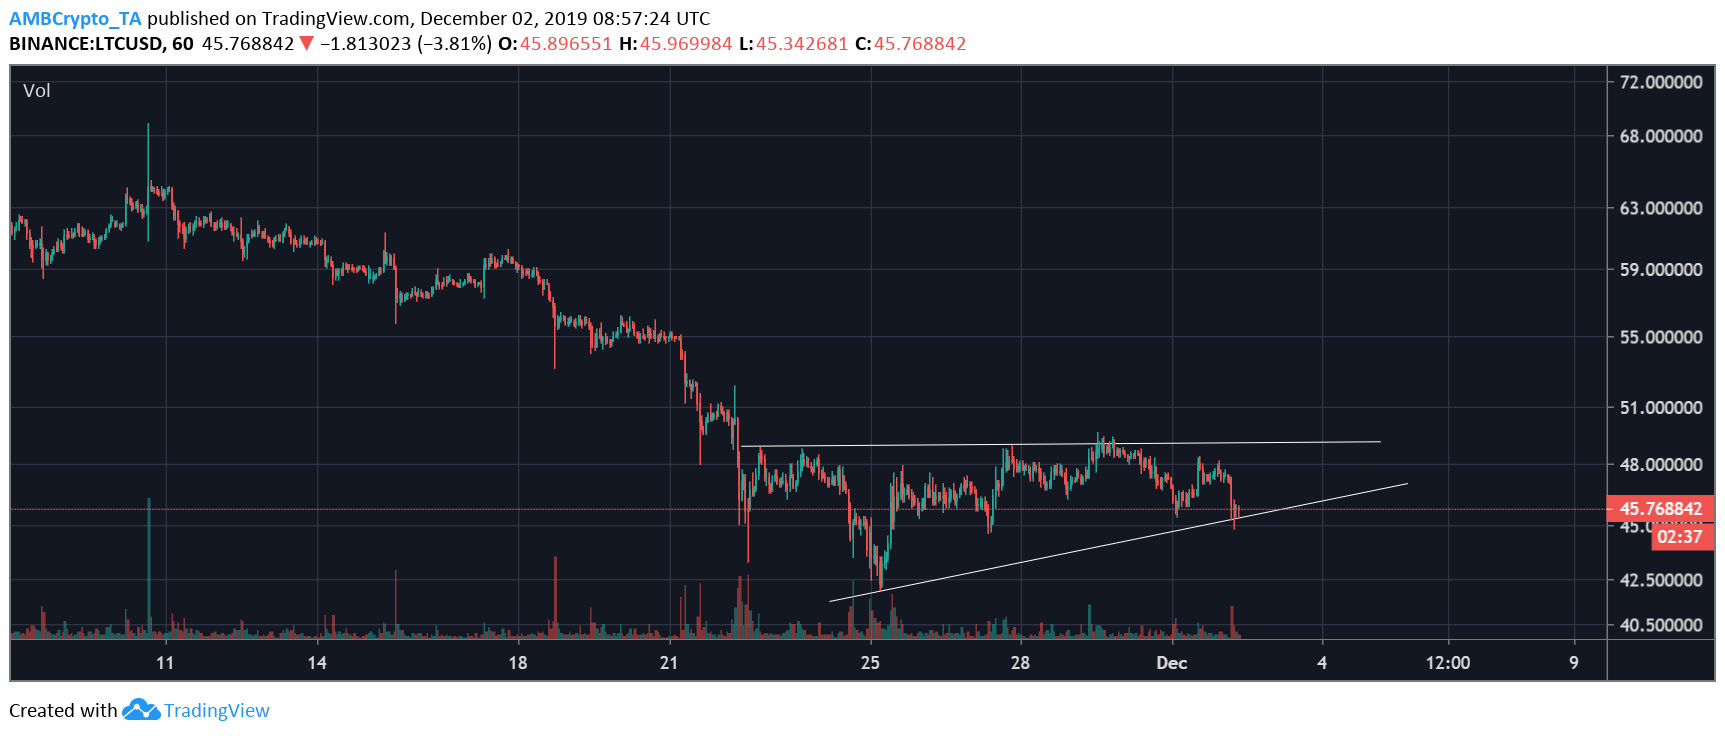
Source: LTC/USD on Trading View
Litecoin, on its one-hour chart, formed an ascending triangle pattern with an upper trend line displaying major resistance at $49.92. This resistance line was followed by a lower trend line which formed higher lows at $41.9, $45.15 and $45.44. The above chart revealed that the price of LTC has been going downhill since 11 November. However, towards the end of November, the price seemed to travel sideways. The formation of the aforementioned pattern could come as a respite to the altcoin as the direction of the breakout of this pattern is upwards.
Additionally, apart from certain instances, the LTC market has recorded low volumes.
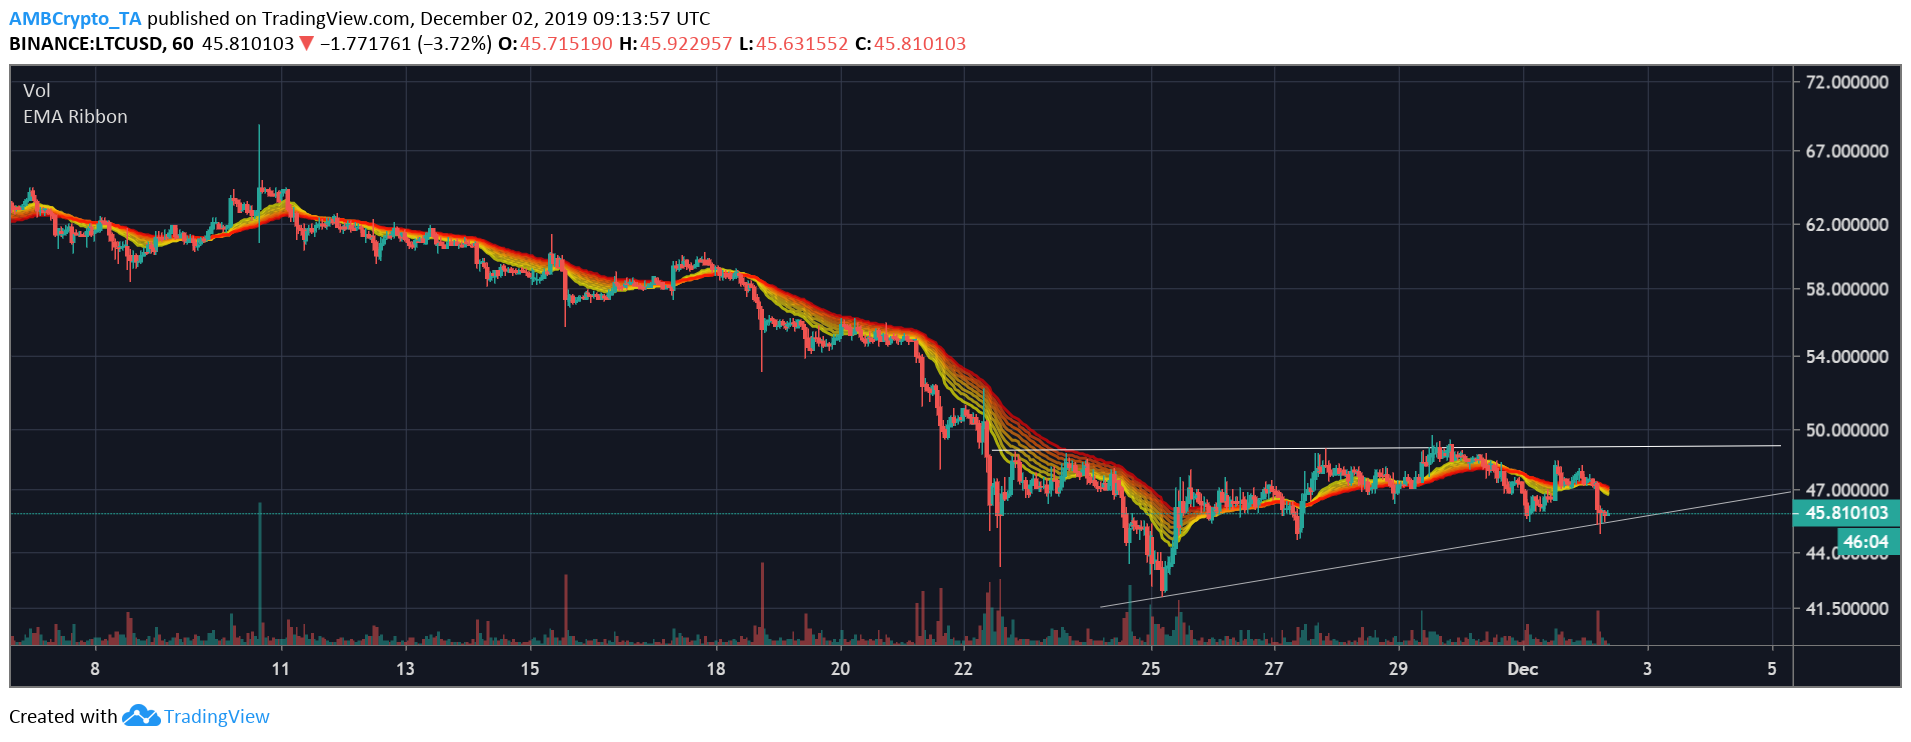
Source: LTC/USD on Trading View
Contrary to the formation of an ascending triangle pattern, the EMA Ribbon revealed a bearish sentiment. Throughout the pattern, the candlesticks remained above the EMA Ribbon, indicating a bull market. However, towards the end of the pattern, the candlesticks moved below the EMA Ribbon and highlighted a bearish market.
Key Indicators
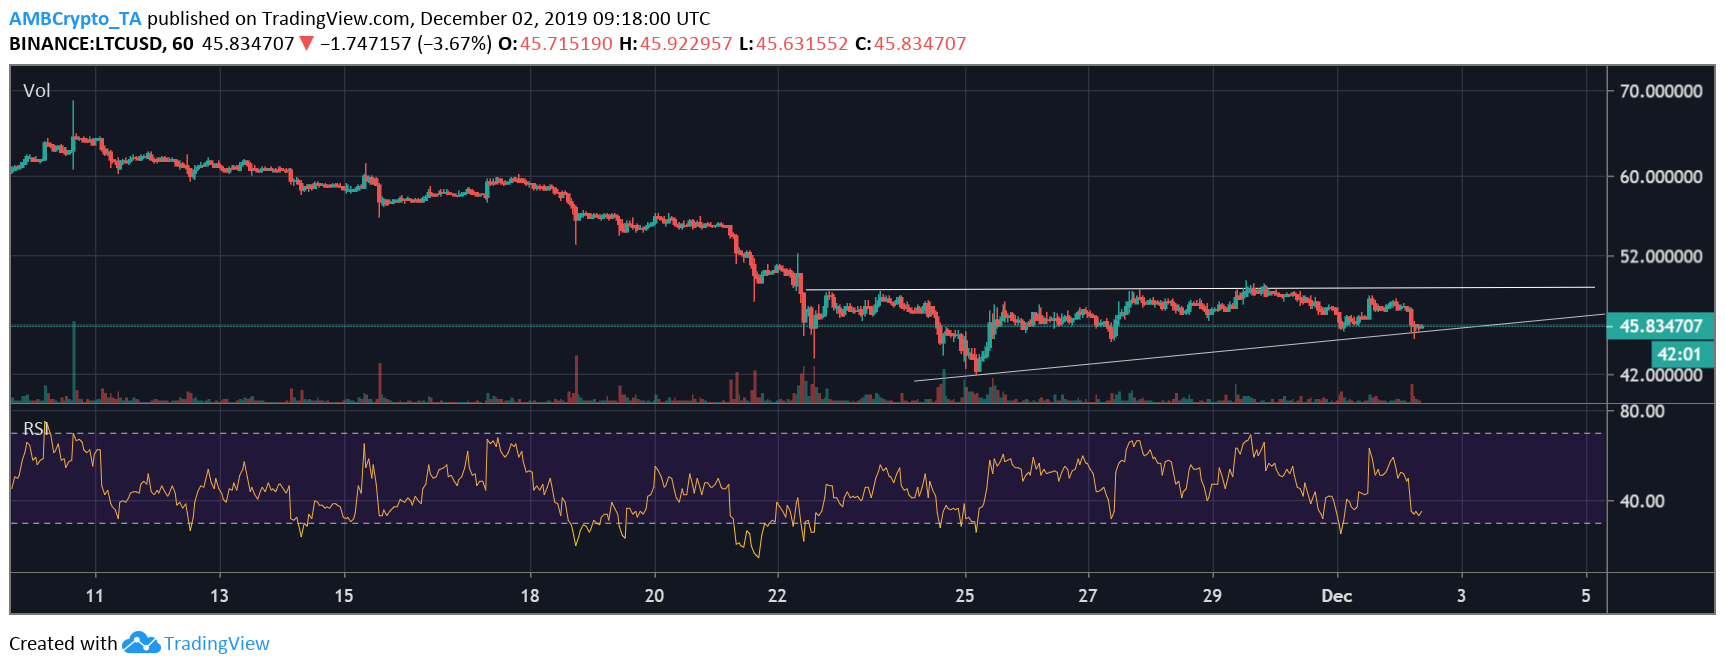
Source: LTC/USD on Trading View
Additionally, the Relative Strength Index also opposed the formation of a bullish pattern as the RSI marker was headed towards the oversold zone. The marker was at a low of 33.93 median. Despite hitting the oversold zone just yesterday, the coin recovered and almost went to the overbought zone. However, the current movement might put Litecoin in the oversold zone.
Conclusion
The short-term chart for LTC formed a bullish pattern that could relieve the altcoin and revive its fortunes. However, there remained some key indicators that sided with the bears.


![Three days ago, Uniswap [UNI] attempted a breakout from a parallel channel, surging to hit a local high of $7.6. However, the altcoin faced strong rejection.](https://ambcrypto.com/wp-content/uploads/2025/06/Gladys-83-400x240.jpg)

