Analysis
Litecoin’s price could spiral below key support after symmetrical triangle closes


Over the last week, Litecoin has lost over 24% and the coin has failed to rebound and was priced at $54.93 at press time, after falling 1.86% in the past one hour. The silver crypto had dramatically lost value over the past month and this trend has been continuing since its halving.
Litecoin 1-hour Chart:


Source: TradingView
Litecoin’s hourly chart exhibited formation of a symmetrical triangle pattern with price levels of the coin treading between two converging trendlines. Higher highs for the altcoin stood at $58.40, $56.91 and $56.51 and the higher lows on the one-hour chart were found at $52.55, $53.93 and $54.50.
The continuation of price action ranging within the symmetrical triangle pattern was indicative of a price breakout on either side. However, MACD indicator, with the reading line below the signal line, projected a bearish phase for the altcoin. This further suggested that the price of the coin could potentially slide lower to the support at $52.68. The above chart also indicated that resistance at $65 could remain potentially untested in the near term.
Litecoin 4-hour Chart:

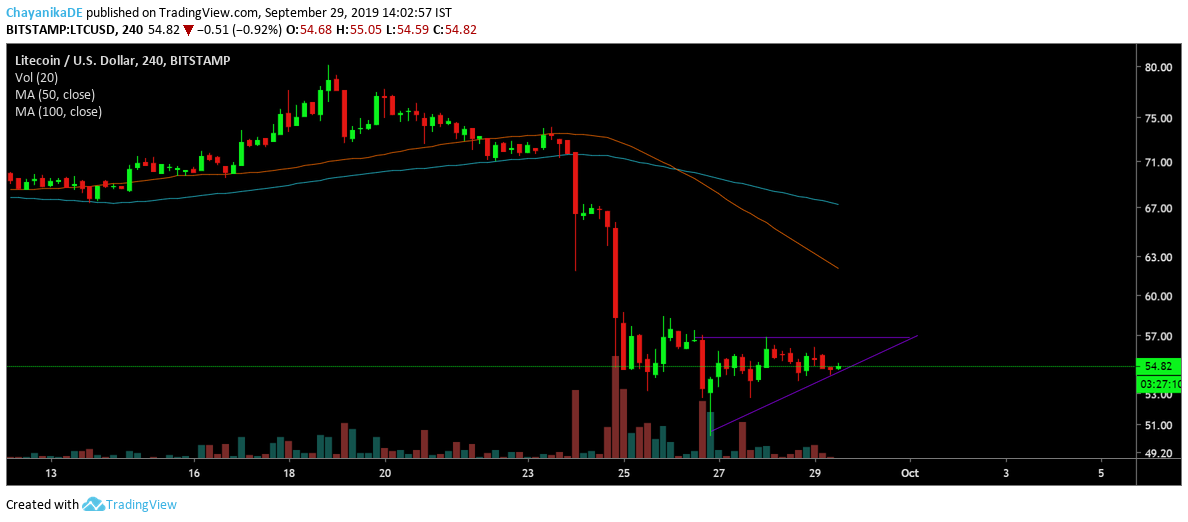
Source: TradingView
Litecoin’s four-hour chart pictured formation of an ascending triangle with prices moving between a horizontal and an upward sloping trendline. The chart exhibited a breakout in the near term with the price consolidating and the corresponding decline in volume. This was indicative of a potential price breakout in the upward direction.
However, 50 moving average line rested below the 100 moving average, suggesting a bearish market trend for the coin.
Conclusion:
Despite signs of bullish divergence by ascending triangle formation, short-term Litecoin charts edged with the bears. A potential price breakout downward can cause the silver crypto’s price to drop severely.