Litecoin’s price may re-test resistance after breach of descending channel

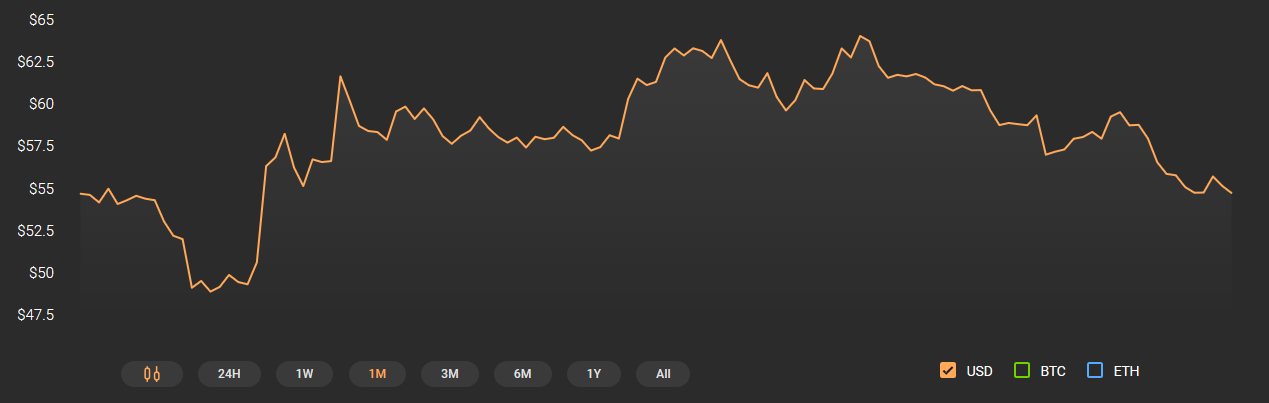
After a significant hike on 25 October, Litecoin continued to record sideways movement on the charts, with Bitcoin’s silver counterpart consolidating between the range of $57.43 and $64.36. However, after testing its major resistance on 10 November, Litecoin’s valuation has slowly declined over the past seven days. Upon analysis, however, Litecoin might see another rise in the near future.
At press time, Litecoin was valued at $55.67 and had a 24-hour trading volume of $2.9 billion.
1-day chart
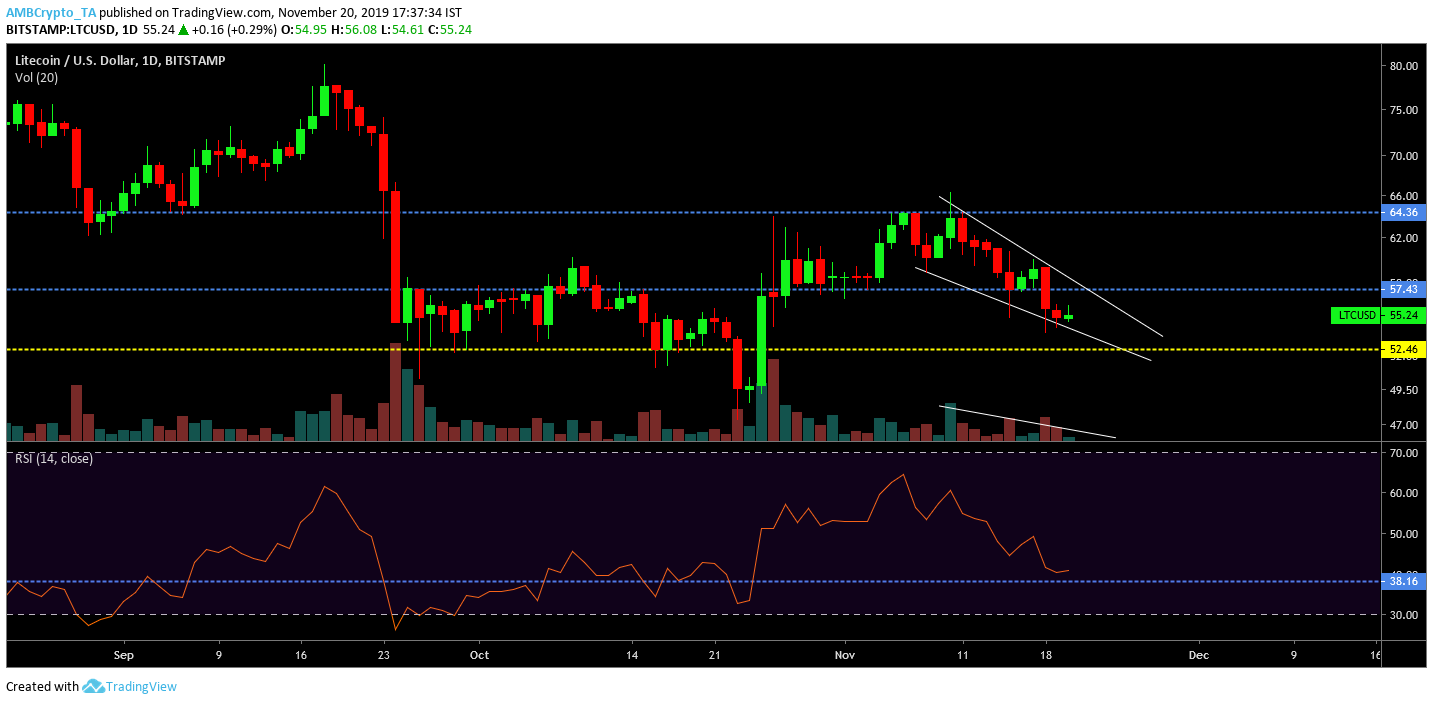
The 1-day chart for Litecoin clearly identified the rise on 25 October, a rise which breached the major resistance at $57.43. The $57.43 line maintained its position as support for the past two weeks, but a decline of over 10 percent on 18 November brought the valuation below the mark again. However, the present price movement had given rise to a falling wedge pattern, at press time. The formation indicated the possibility of a bullish breakout for the asset, a movement that might let Litecoin retest the resistance at $57.43.
The support for the coin was placed at $52.46, at press time, and the declining trading volume also confirmed the validity of the pattern.
At first glance, the RSI appeared to be bearish. However, the indicator had support at the 38.16 mark. In the past, the indicator managed to bounce back from this point, a development that improved the coin’s chances of a trend reversal.
12-hour chart
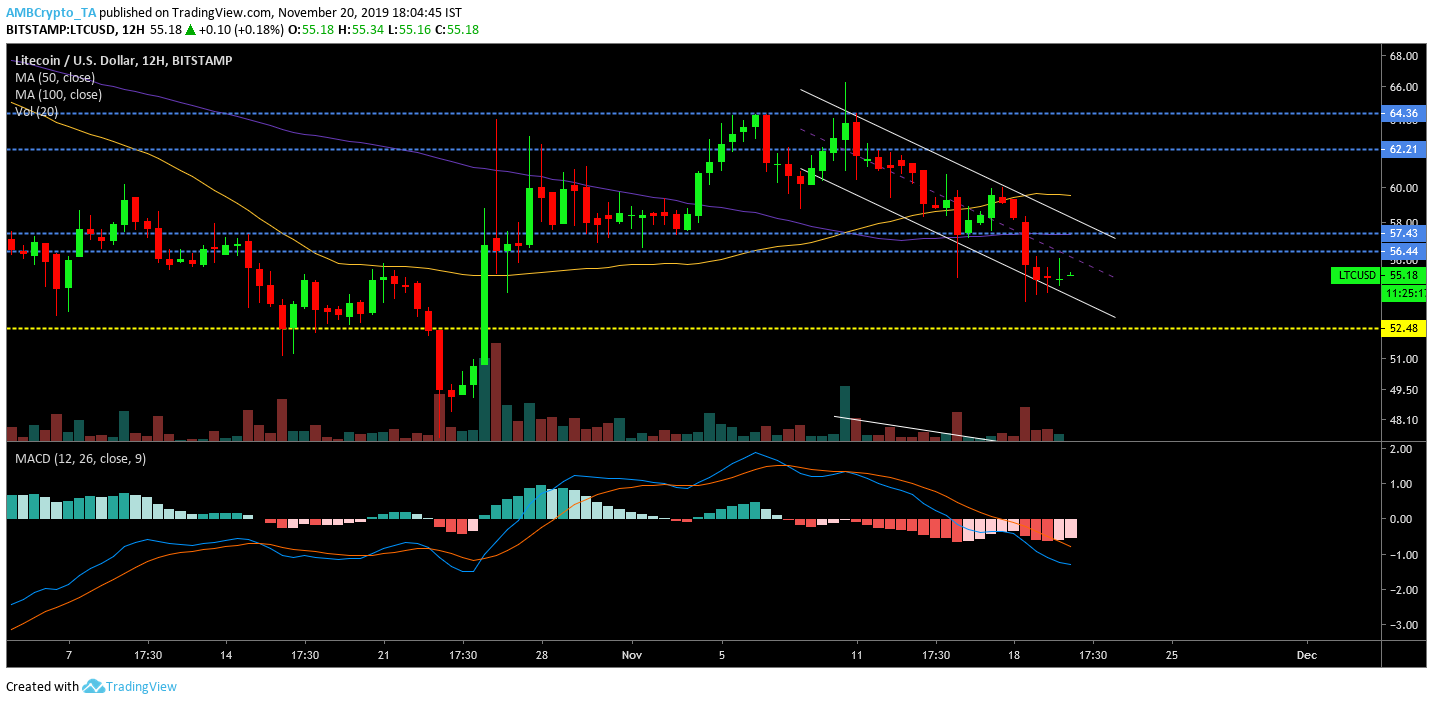
Similar to the 1-day chart, the 12-hour chart exhibited a bullish trend as the price movement resulted in the formation of a descending channel. The channel registered a couple of prominent lower highs and lower lows which validated the trend lines. The immediate resistance for the bullish break was lined at $56.44 and $57.43, and the long term resistance was placed at $62.21. A major bullish sign was evident between the Moving Averages as the 50-Moving Average completed a bullish crossover with the 100-Moving Average.
However, while the trade volume continued to drop, it should rise after the breakout. The MACD indicator suggested a bearish trend, but the MACD line and the signal line appeared to converge in the charts and increased the likelihood of a trend reversal.